Corporate ESG, TNFD and Green Credit monitoring for Indian industry
7 in 10 plantation sites audited in India showed no change in tree cover. We help your plants prove theirs is growing.
CAG audit · Aug 2026Green India Mission: satellite analysis found no tree-cover change at 107 of 153 sampled sites
Commitments are made once. Proof is needed continuously.
- Scattered evidence
Field surveys, photos, spreadsheets and consultant reports sit in different places.
- Periodic, not continuous
Progress is checked at audit time, not while problems can still be fixed.
- Rising outcome-based rules
Greenbelt conditions, Green Credit norms and ESG disclosures reward results, not activity.
- Unreliable offset quality
Buyers struggle to verify what a project actually delivers.
- Manual reporting
Teams spend weeks compiling data that should already exist.
- Climate and supply chain exposure
Physical risk and deforestation are hard to see across sites and suppliers.
Every number behind your greenbelt, carbon and biodiversity claims.
Five groups of indicators per site, measured at baseline and re-measured at every assessment.
We map the site boundary, the clearance conditions that apply to it and its land-use history back to the year it was established, so every later change has a reference point.
Greenbelt, biodiversity and carbon MRV
Know what each plant's greenbelt and plantation has achieved, zone by zone, with numbers you can defend.
Measured at every assessment
Site baseline
Land-use history from the year the site was established, canopy, terrain and water bodies, from the satellite archive.
Greenbelt compliance
Measured green cover against your 33% (or other) clearance condition, tree density and belt width, zone by zone.
Carbon quantification
Above- and below-ground biomass and soil carbon, calibrated on field plots, with uncertainty.

Monitored and delivered
Biodiversity and habitat
Canopy layers, vegetation health, habitat condition, wetland extent and species records.
Change and risk alerts
Canopy loss, stressed zones, fire and drought signals between assessments.
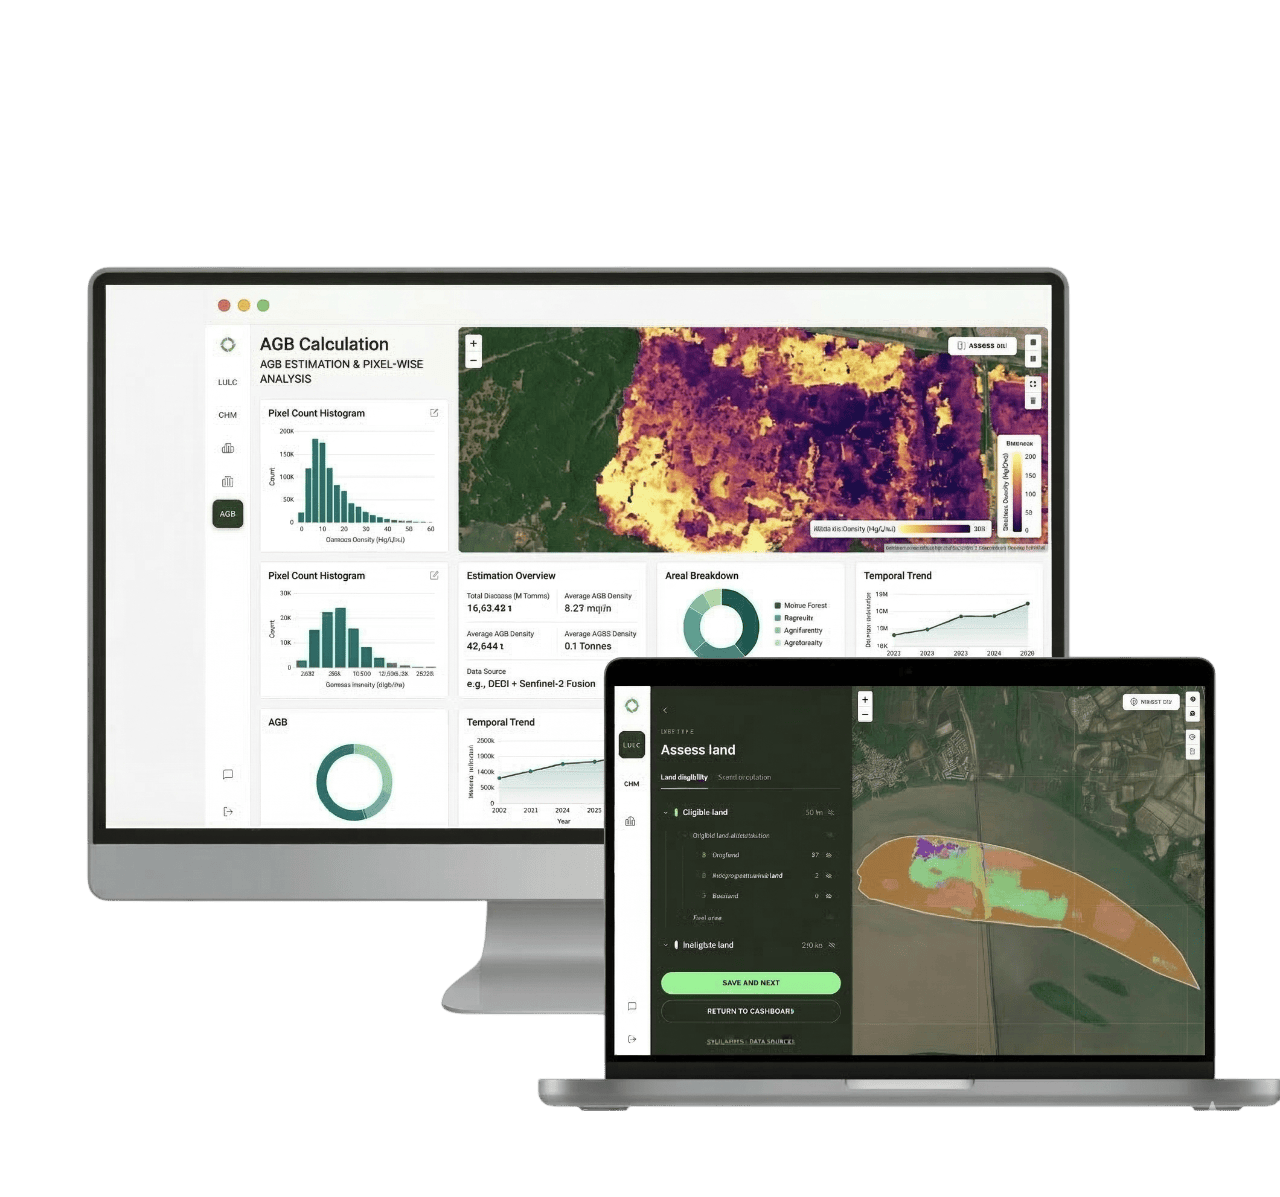
Site dashboard
Every result, map layer and supporting file for each site, in one place for your team and your assurer.
Also from Sylithe
- Carbon offset due diligence before you buy credits
- Green Credit Programme parcel screening and progress tracking
From your site boundary to published results.
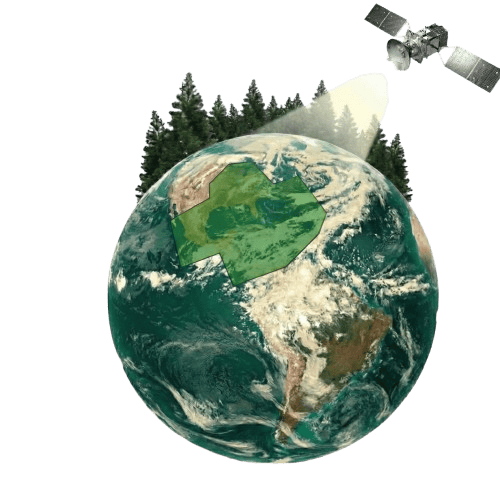
Share each site boundary (KML or GeoJSON) and its clearance conditions. Your site appears on your Sylithe dashboard the same day.


Proof that holds up, not photos and spreadsheets.
How greenbelt and plantation evidence is usually put together, and what changes with Sylithe.
Typical greenbelt reporting
Sapling counts and photographs as evidence
Checked once a year, just before the report is due
No link between green cover and the clearance condition
Carbon sequestration estimated from tree counts alone
Figures scattered across consultants and spreadsheets
No uncertainty, hard to defend in an audit
SylitheMeasured green cover against your exact condition, by zone
Baseline plus regular monitoring between assessments
Satellite, drone and field plots combined
Carbon from calibrated biomass, with uncertainty
One dashboard per site with every map, number and file
Every figure traceable to its imagery, date and method
Green Credit for corporates, without the guesswork.
India's Green Credit Programme rewards verified environmental restoration. For plantation and restoration, credits now depend on outcomes, not planting counts.
How Sylithe helps
Before you commit to a parcel, we check its baseline canopy, encroachment and land condition from the satellite archive, so you know what you are taking on.
Sample parcelCanopy density over the five-year period Illustrative trajectory, not data from a real parcel.
The same site, before and after.
Drag the handle across a real industrial site in Sanand, Gujarat. In January 2014 the block beside the plant was dry scrub around a lake. By December 2025 it had become dense tree cover, while the factory next to it kept running. This is the change we measure, in hectares, trees and tonnes of carbon.
Before · Jan 2014
≈9%canopy cover
After · Dec 2025
≈47%canopy cover
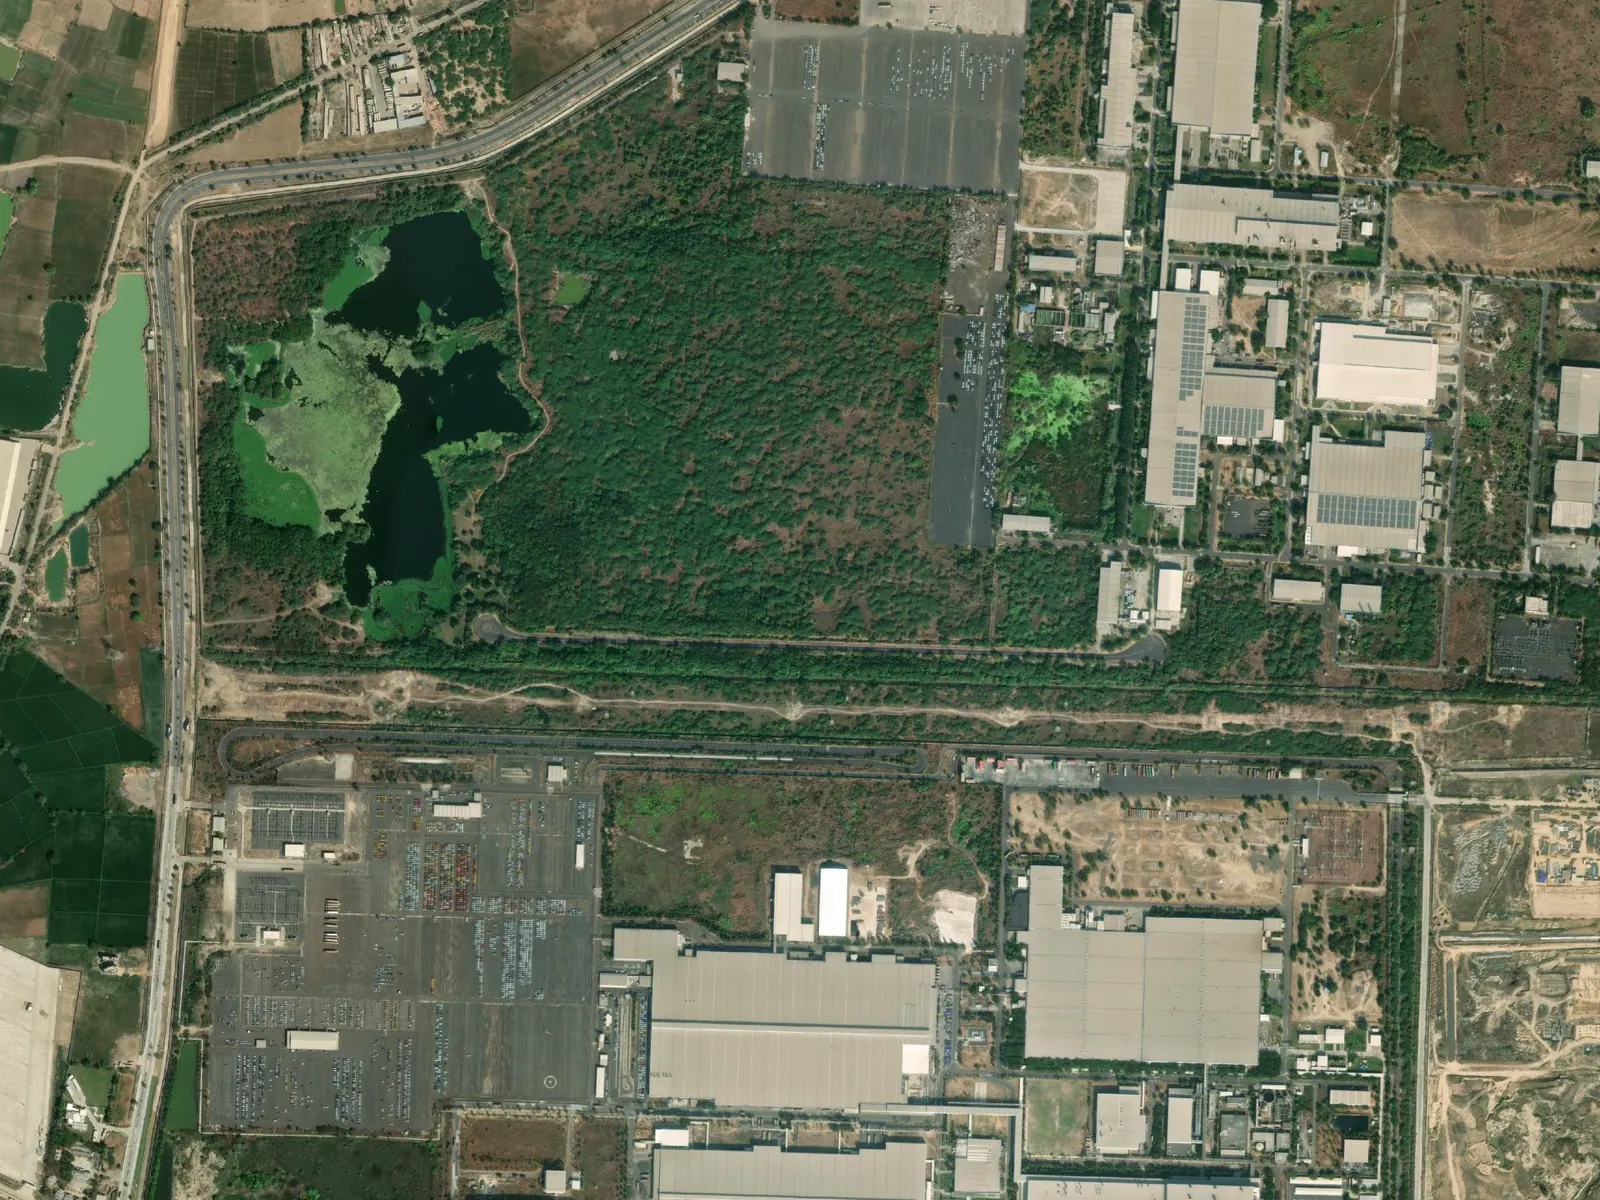
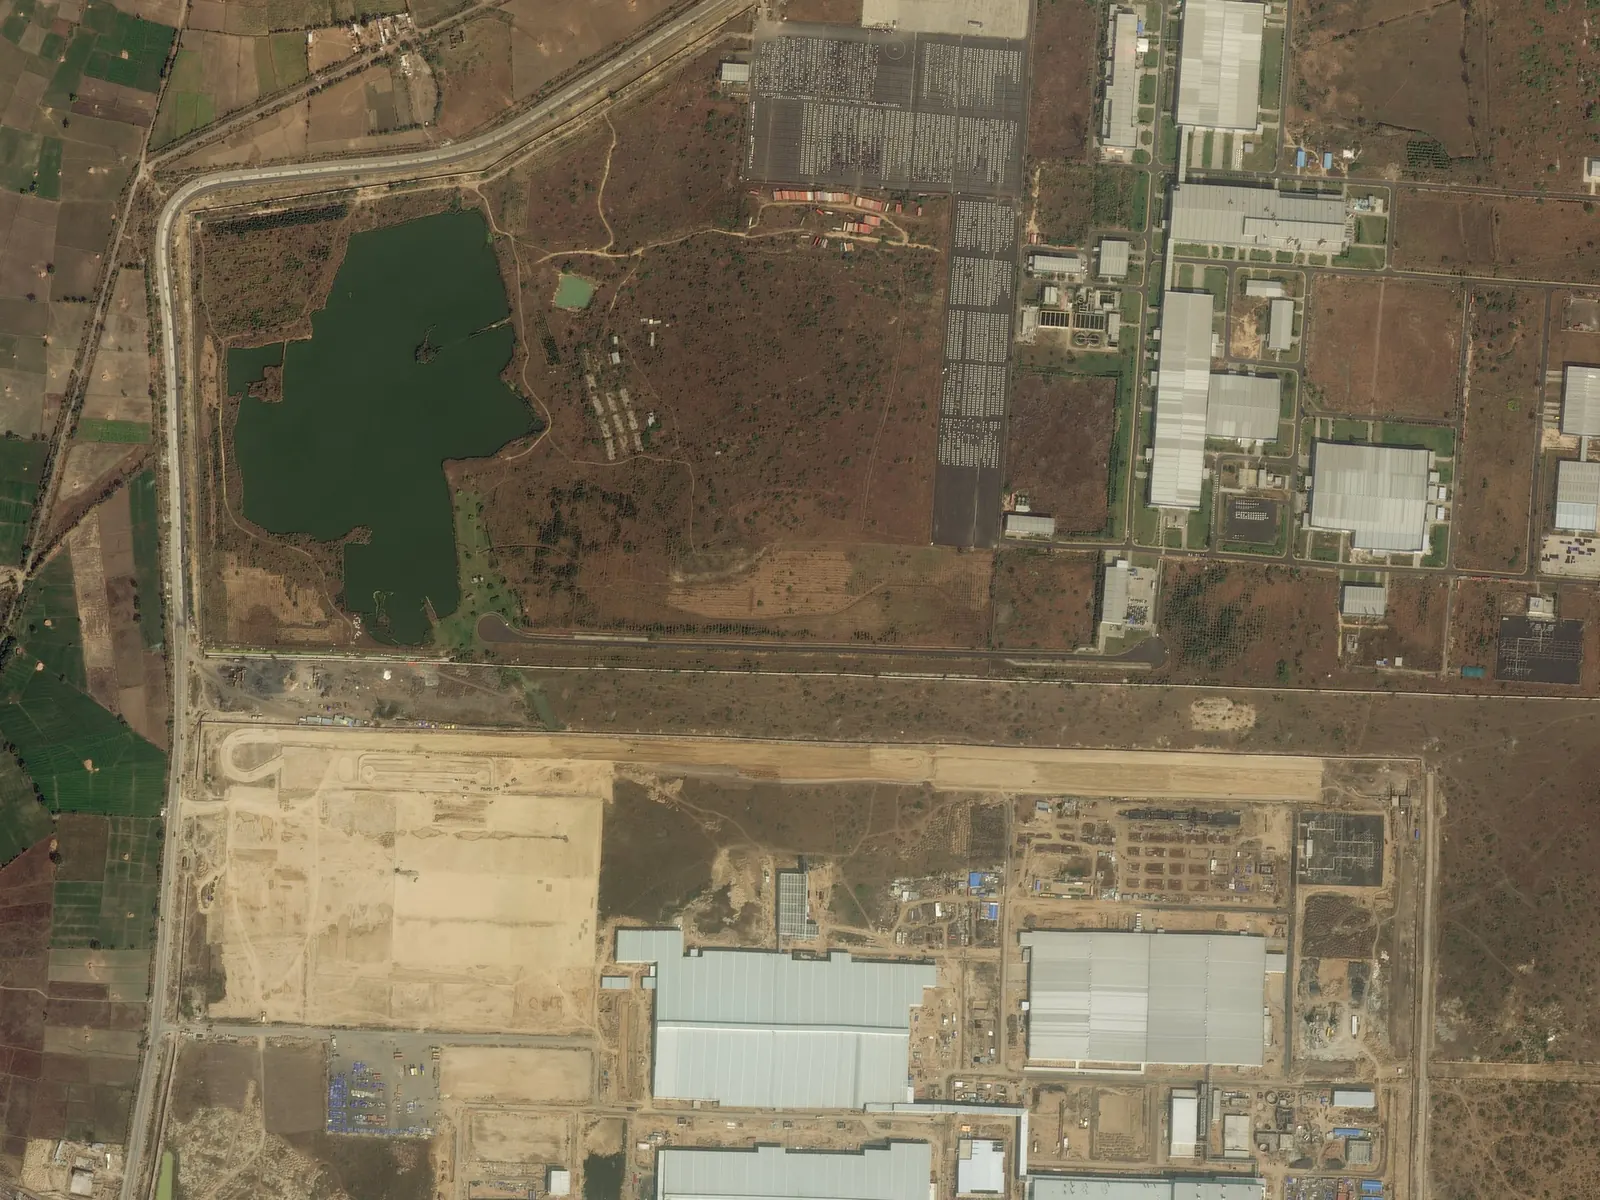
ImageryReal satellite images, Jan 2014 and Dec 2025 Maxar WorldView-2 and WorldView-3 via Esri World Imagery Wayback. Canopy cover of the planted block is a rough estimate from the images. Shown for illustration; not a Sylithe client site.
Your plant, measured
Want to see this on your own plant?
Share your work email. We will map your greenbelt against your clearance condition and walk your team through it.
How Sylithe measures.
Every output traces back to a satellite scene, a model version and a date. Here is the pipeline behind each greenbelt and restoration report.
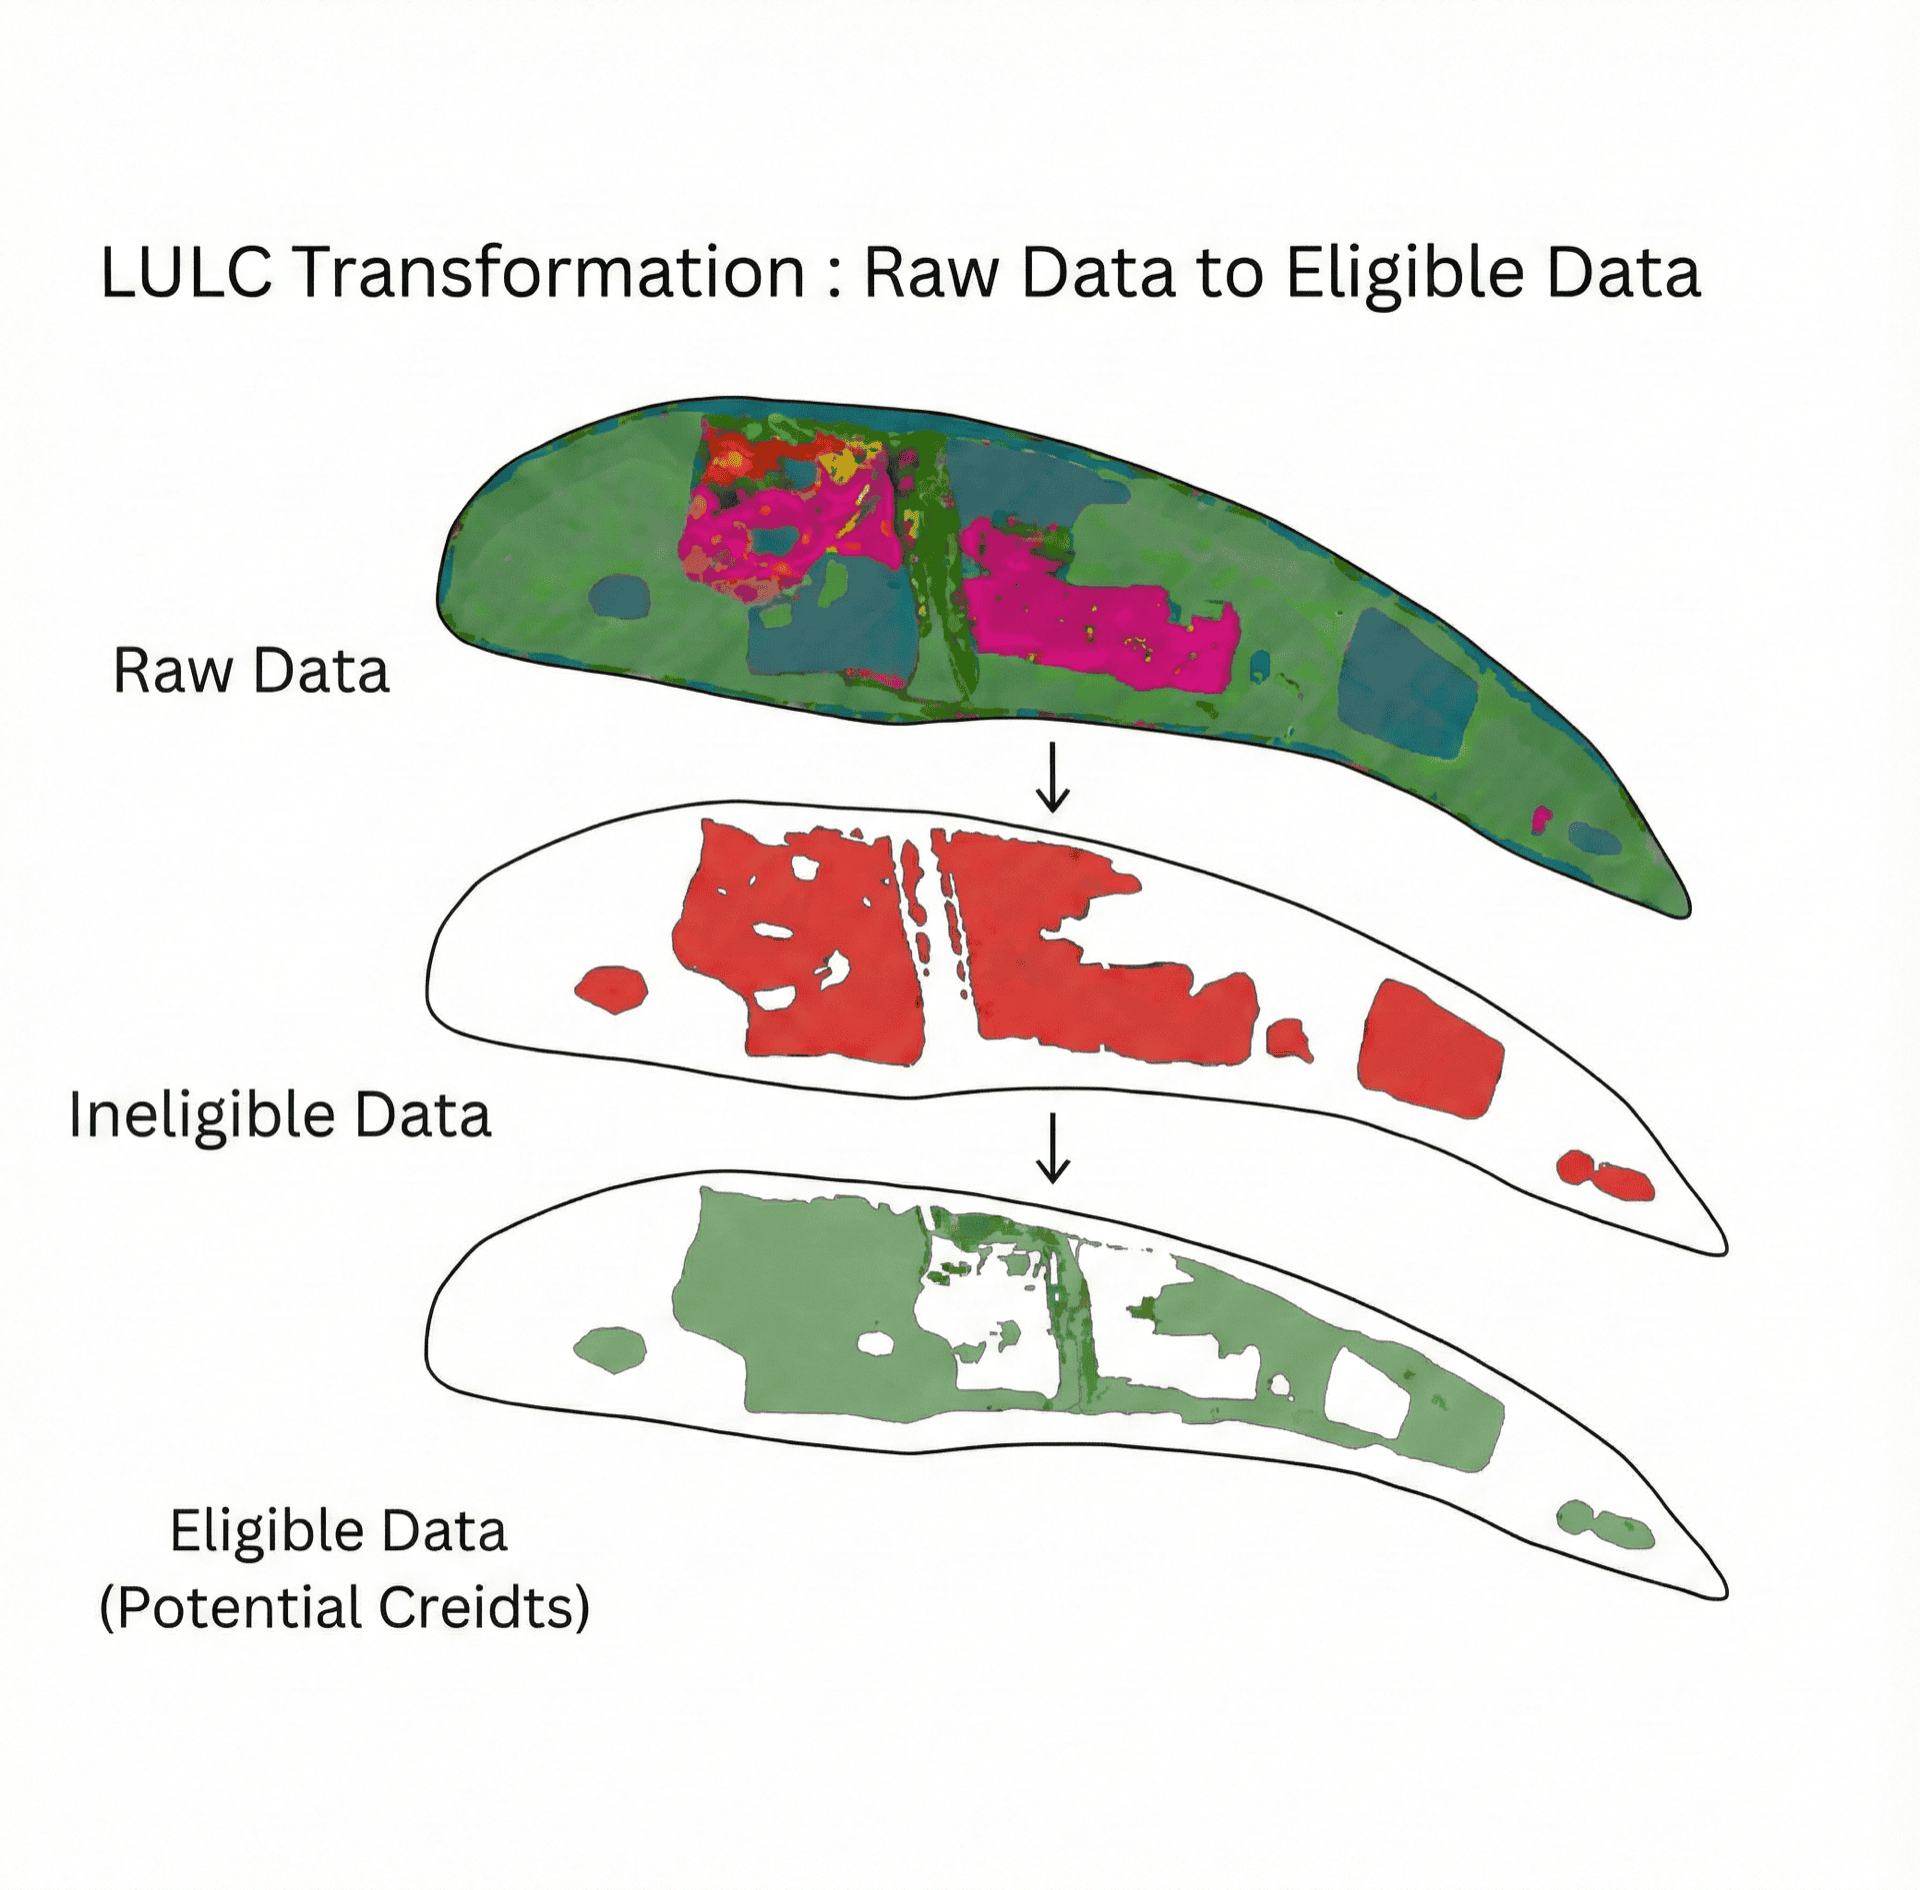
Map land cover, vegetation, canopy, terrain and history using multi-year optical and radar imagery and our 10 m LULC classification.
LULC classificationOur principles
- Satellite plus field validation, not satellite alone
- Every number traceable to its source image and date
- Uncertainty reported, not hidden
- Reproducible: same inputs, same results
- Versioned records for audit
Built for the obligations you already have.
Corporate ESG, BRSR, TNFD and Green Credit needs, and what Sylithe gives you to meet each one.
Compliance and disclosure
Environmental clearance greenbelt condition (e.g. 33%)
Measured green cover, tree density and belt width against the condition, for your six-monthly compliance report
EC condition on GHG inventory and carbon sequestration
Carbon stock and annual removals of your greenbelt, with uncertainty
BRSR Principle 6 and BRSR Core
Biodiversity, green cover and land data per site, traceable for assurance
Nature-related disclosures (TNFD)
Site location, habitat condition and nearby protected areas for the LEAP approach
Programmes and purchasing
CSR plantation programmes
Survival, canopy growth and carbon of what was planted, not just sapling counts
Green Credit Programme
Parcel screening and canopy progress against the 40% threshold
Carbon offset purchasing
Satellite-based due diligence on projects before you buy
One evidence base, every team.
- 01EHS and compliance
Know your greenbelt status before the regulator asks.
- Green cover vs. condition, by zone
- Gap map for replanting
- 02Sustainability and ESG
Defensible figures for BRSR and TNFD.
- Carbon stock and removals with uncertainty
- Biodiversity and habitat indicators
- 03CSR
Show what plantation spend actually achieved.
- Survival and canopy growth
- Before-and-after imagery
- 04Procurement and finance
Verify offsets before buying.
- Offset due-diligence findings
- Project risk signals
- 05Auditors and consultants
Evidence you can trace.
- Every figure linked to its imagery and date
- Methodology and uncertainty statement
Data your teams can use and defend.
Everything arrives on your site dashboard, version-stamped and ready to lift into your own reports.
- Greenbelt share vs. your conditionBy zone
- Tree count, species and canopyPer tree
- Carbon stock and removals± uncertainty
- Biodiversity and wetland indicatorsPer site
- Drone and satellite map layersGeoTIFF · KML
- Methodology and uncertainty statementPDF
See your greenbelts and plantations clearly.
Tell us about your sites. We will show you what Sylithe can measure there.
Prefer email? info@sylithe.com
Corporate ESG, TNFD and Green Credit questions.
Sylithe measures the land, greenbelt, carbon and biodiversity side of corporate ESG for each plant: green cover against the clearance condition, tree count, carbon stock and annual removals with uncertainty, and habitat and wetland indicators. Every figure links to the imagery, model version and date behind it, so it can go into BRSR, TNFD and EC compliance reports and hold up when assured.
The Taskforce on Nature-related Financial Disclosures (TNFD) is a voluntary framework, published in September 2023, for reporting nature-related dependencies, impacts, risks and opportunities. Its LEAP approach starts by locating your sites against sensitive ecosystems. Sylithe supplies that site-level evidence for each plant: land-cover change, habitat condition, wetland extent and distance to protected areas.
Under India's Green Credit Programme, a company funds the restoration of a degraded land parcel allotted through a state forest department. Credits depend on the result: the parcel has to reach the required canopy density (currently 40%) after the five-year restoration period. Sylithe screens the parcel before you commit, tracks canopy every season, maps failing blocks for replanting and assembles the claim evidence. Verification and issuance stay with the government's designated authorities.
Mainly Principle 6 (environment) of SEBI's Business Responsibility and Sustainability Report: operations in or near ecologically sensitive areas, biodiversity impact and land use, plus greenbelt carbon removals reported separately from Scope 1 and 2 emissions. Sylithe provides the measured figures and evidence; your team includes them in its own disclosure.
Most industrial ECs require a greenbelt over at least 33% of the project area, usually three tiers of native species at a set tree density (often 2,500 trees per hectare), with survival monitored and dead plants replaced. Sylithe measures the achieved share, density and belt width against your exact condition.
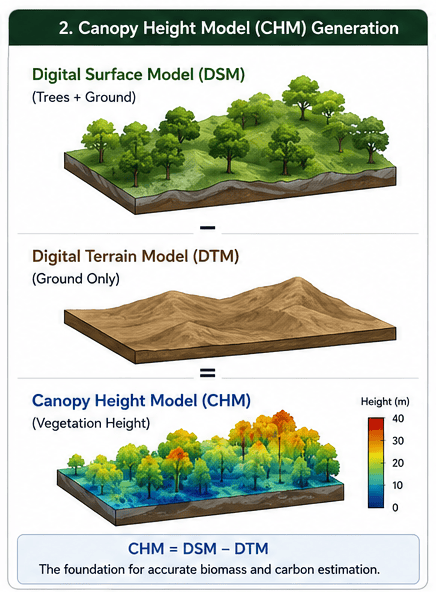
Trees are counted and their height measured from drone and high-resolution imagery, calibrated with field sample plots, then converted to above- and below-ground biomass and carbon using IPCC 2006/2019 methods. We report the result with its uncertainty and track the change between assessments.
Yes, as removals reported separately from your Scope 1 and 2 inventory. They should not be netted against emissions. Sylithe provides the figures and evidence; your team includes them in its own disclosure.
No. We supply the measured greenbelt, carbon and biodiversity data and the evidence behind it, tagged to the requirement it supports. Your team or consultant files the report.
No. Under the Green Credit Programme, credits cannot be used for site-specific obligations such as the 33% greenbelt or mine-lease plantation. They can support compensatory afforestation, CSR and ESG reporting.
No. Satellite monitoring gives continuity, and drone and field data validate and calibrate it.
Yes. We use historical imagery to rebuild the trend from the year the site was established to today.
Any company with greenbelt, plantation or restoration obligations, typically cement, steel, power, mining, oil and gas, chemicals and manufacturing.