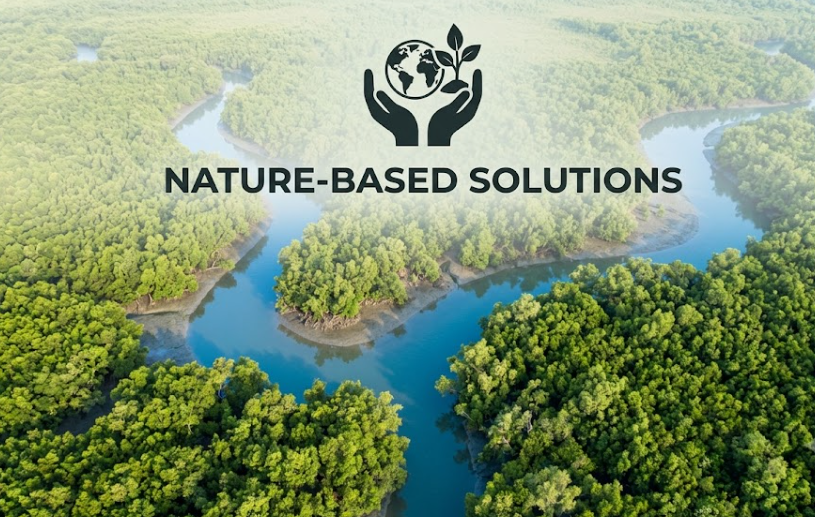
Of all the ecosystems that store carbon, mangroves are among the most efficient and among the hardest to measure. Per hectare, a healthy mangrove can sequester carbon at rates three to five times higher than a tropical rainforest driven by exceptional rates of organic matter burial in the oxygen-poor sediments beneath the waterline. They also provide irreplaceable co-benefits: coastal protection from storm surge, nursery habitat for marine fisheries, livelihoods for tens of millions of coastal communities across Asia, Africa, and Latin America.
India's approximately 4,900 square kilometres of mangrove cover concentrated in the Sundarbans delta of West Bengal and the Andaman and Nicobar Islands, with significant stands in Odisha, Gujarat, Maharashtra, and Goa represents one of the world's most significant coastal carbon assets. It is also one of the most technically difficult to verify with the rigour that high-integrity carbon markets increasingly demand.
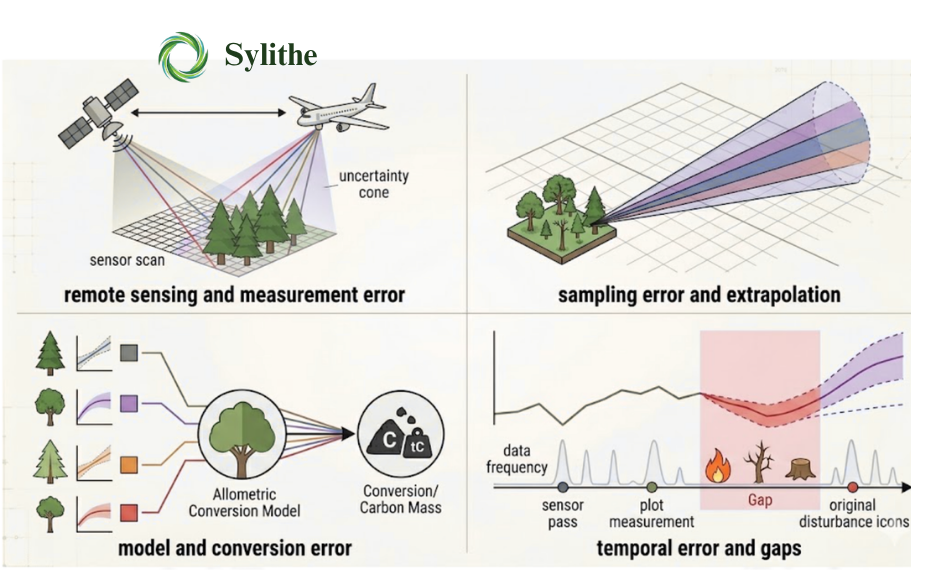
The difficulty is not a matter of satellite resolution or computing power. It is structural. The methodological toolkit that has been refined over decades for verifying tropical forest carbon optical imagery, NDVI-based classification, periodic field surveys, allometric biomass models was designed for a world where the ground stays still. In a mangrove, it does not. And building a verification system that handles dynamic, tidal, saline, optically complex coastal environments requires rethinking the technical stack from the ground up.
Key Statistics
• 4,900 km²: India mangrove cover • 3–5×: Higher carbon density vs. tropical forest • ~80%: Mangrove carbon stored below ground in soil • 5 m: Max tidal range in Sundarbans
Why mangroves are not just "coastal forests"
The temptation when approaching blue carbon verification is to treat mangroves as a variant of tropical forest carbon apply the same optical classification pipeline, adjust a few parameters for coastal conditions, and proceed. This is the approach that has produced a generation of blue carbon projects with verification methodologies that are formally compliant but practically inadequate.
Mangroves differ from terrestrial forests in three fundamental ways that break standard forestry verification tools:
Why Mangroves Matter For Climate Change
Mangroves occupy a relatively small percentage of the global coastline, yet they play an outsized role in climate mitigation. Their ability to capture atmospheric carbon and store it in long-lived coastal sediments makes them one of the most efficient natural carbon sinks on Earth.
Beyond carbon storage, mangroves reduce coastal erosion, buffer storm surges, improve water quality, and provide nursery habitats for commercially important fish species. These ecosystem services create significant climate adaptation and biodiversity value in addition to carbon benefits.
- Dynamic inundation: The substrate they grow on alternates between exposed mud flat and submerged seafloor twice a day. A satellite overpass at high tide sees a fundamentally different spectral signature than one at low tide.
- Persistent cloud cover: Mangroves predominantly occur in humid tropical coastal zones with high cloud cover. A verification pipeline dependent on cloud-free imagery cannot achieve required monitoring frequency.
- Belowground carbon dominance: In mangroves, up to 80% of carbon is stored belowground in anoxic sediments. Measuring trees is like auditing a company by counting its office furniture you ignore the substantial majority.
The tidal trap: why standard optical tools fail
Optical sensors Sentinel-2, Landsat, Planet measure reflected sunlight across visible and near-infrared wavelengths. In mangrove environments, they face a fundamental signal-mixing problem that cannot be solved by resolution alone.
A single 10-metre Sentinel-2 pixel in a dense mangrove stand at high tide is a spectral cocktail: canopy reflectance, backscatter from water channels, and the signature of saline water. The NDVI drops dramatically at high tide, which a naive classifier interprets as deforestation.
The Tidal Approach Comparison
Standard Approach: Tide-blind classification. Applies uniform NDVI thresholds, leading to false deforestation signals at high tide. Tidal-adaptive Approach: Ingests real-time tidal harmonic data and models water depth for every pixel to correct spectral indices before classification.
Tidal normalization in practice
The tidal correction workflow ingests predicted tidal heights from harmonic analysis and generates a water depth estimate for every pixel at the moment of overpass. Spectral indices are then adjusted before classification algorithms are applied.
Beyond correction, tidal timing can be used as a monitoring asset. By selecting image acquisitions at consistent low-tide windows, monitoring uncertainty can be systematically reduced the equivalent of scheduling a medical scan at a specific point in a breathing cycle.
The power of SAR: seeing through cloud and tide
Synthetic Aperture Radar (SAR) makes consistent monitoring possible. Clouds are transparent to microwave radiation. SAR acquires data regardless of weather day, night, monsoon, or dry season.
For mangrove monitoring, SAR responds to the physical structure of vegetation. This structural sensitivity produces signals that are diagnostic for mangrove forest in ways that optical indices cannot replicate.
Double-bounce scattering
When a radar pulse strikes a flooded mangrove stand, it undergoes a double-bounce interaction: reflecting from the water surface to the trunk and back to the satellite. This signature is the gold standard for confirming forest presence in tidal conditions.
Double-bounce scattering is particularly valuable because it creates a radar signature rarely found outside flooded forests. This allows analysts to distinguish mangrove ecosystems from nearby agricultural land, mudflats, and coastal vegetation with much higher confidence.
Because the mechanism depends on both standing water and vertical trunks, it also acts as a natural integrity check. Changes in the strength of the double-bounce signal can reveal structural disturbance long before canopy loss becomes visually obvious.
Volume scattering for canopy structure
At higher radar frequencies, pulses interact with the leafy canopy, providing info on density and height. Combining double-bounce and volume signals produces a multi-dimensional structural profile of the forest.
InSAR phase coherence for early degradation
Radar Interferometry measures phase stability between acquisitions. When a forest begins to degrade, signal coherence drops long before change is visible in optical imagery.
InSAR coherence is especially useful for detecting gradual degradation. Selective logging, hydrological disruption, and storm damage often alter structural stability before they produce measurable canopy loss.
By tracking coherence trends across multiple acquisitions, analysts can identify risk hotspots and prioritize field inspections in areas showing unusual structural change.
Sentinel-1 temporal stack analysis
By building dense temporal stacks of Sentinel-1 acquisitions, it's possible to detect seasonal dynamics and disturbance events with 6–12 day repeat intervals a resolution no manual survey could match.
Advancements in Mangrove Biomass Estimation with SAR
In recent years, the scientific community has made significant leaps in above-ground biomass (AGB) estimation for mangroves, particularly using multi-frequency SAR. Traditional allometric equations derived from extensive field surveys are extremely labor-intensive in dense, muddy mangrove terrains like the Sundarbans. Researchers are increasingly relying on machine learning integrated with radar backscatter to estimate biomass at scale.
L-band vs C-band Radar: Penetrating the Canopy
A prominent challenge in using satellite radar for biomass is signal saturation. In dense, mature mangroves, shorter radar wavelengths (like the C-band from Sentinel-1 or RISAT-1) bounce off the upper canopy. They provide excellent information on canopy structure but fail to penetrate to the primary trunks where the vast majority of biomass is stored. Once the biomass exceeds a certain threshold (typically around 100-150 tons per hectare), the C-band signal saturates, meaning further increases in true biomass do not reflect as an increase in radar backscatter.
This is where L-band SAR, such as from the ALOS-PALSAR-2 satellite, becomes crucial. With a longer wavelength (around 23 cm), L-band pulses can penetrate the leafy canopy and interact directly with the larger trunks and branches of the mangrove trees. Comparative studies in the Indian Sundarbans, notably around Lothian Island, have demonstrated that L-band SAR backscatter (specifically in the HV/VH cross-polarizations) shows a very high correlation with field-measured biomass—achieving R² values up to 0.97. The longer wavelength avoids early saturation, allowing for accurate mapping even in the densest stands.
Total Sundarbans Carbon Estimations
By applying these advanced L-band SAR techniques, researchers have mapped the total above-ground biomass of the entire Sundarbans region. Studies utilizing multi-temporal SAR data (such as JERS and ALOS-PALSAR) have estimated the total AGB of the Sundarbans to be approximately 329 million tons. This provides a critical baseline for sustainable forest management and large-scale carbon crediting projects. Without such landscape-level, remote-sensed biomass estimations, quantifying the "carbon bank" of an ecosystem this massive would be physically impossible.
Machine Learning and Multi-Sensor Fusion
The frontier of mangrove dMRV lies in combining multiple sensors. Modern methodologies integrate radar (e.g., Sentinel-1) and optical data (e.g., Sentinel-2) using machine learning algorithms like Random Forest and Support Vector Machines. This approach leverages the best of both worlds: the cloud-penetrating structural sensitivity of SAR, and the fine-tuned spectral vegetation indices (like NDVI and EVI) from optical sensors. Studies using Google Earth Engine to run Random Forest models on fused datasets have reported remarkable prediction accuracies (R² > 0.98) for AGB and carbon sequestration potential in the Sundarbans.
Soil carbon: monitoring the invisible 80%
The carbon accounting problem hides beneath the waterline. Mangrove soils store the majority of the ecosystem's carbon. Yet dominant approaches treat soil carbon as a fixed coefficient. This fails in systems under stress.
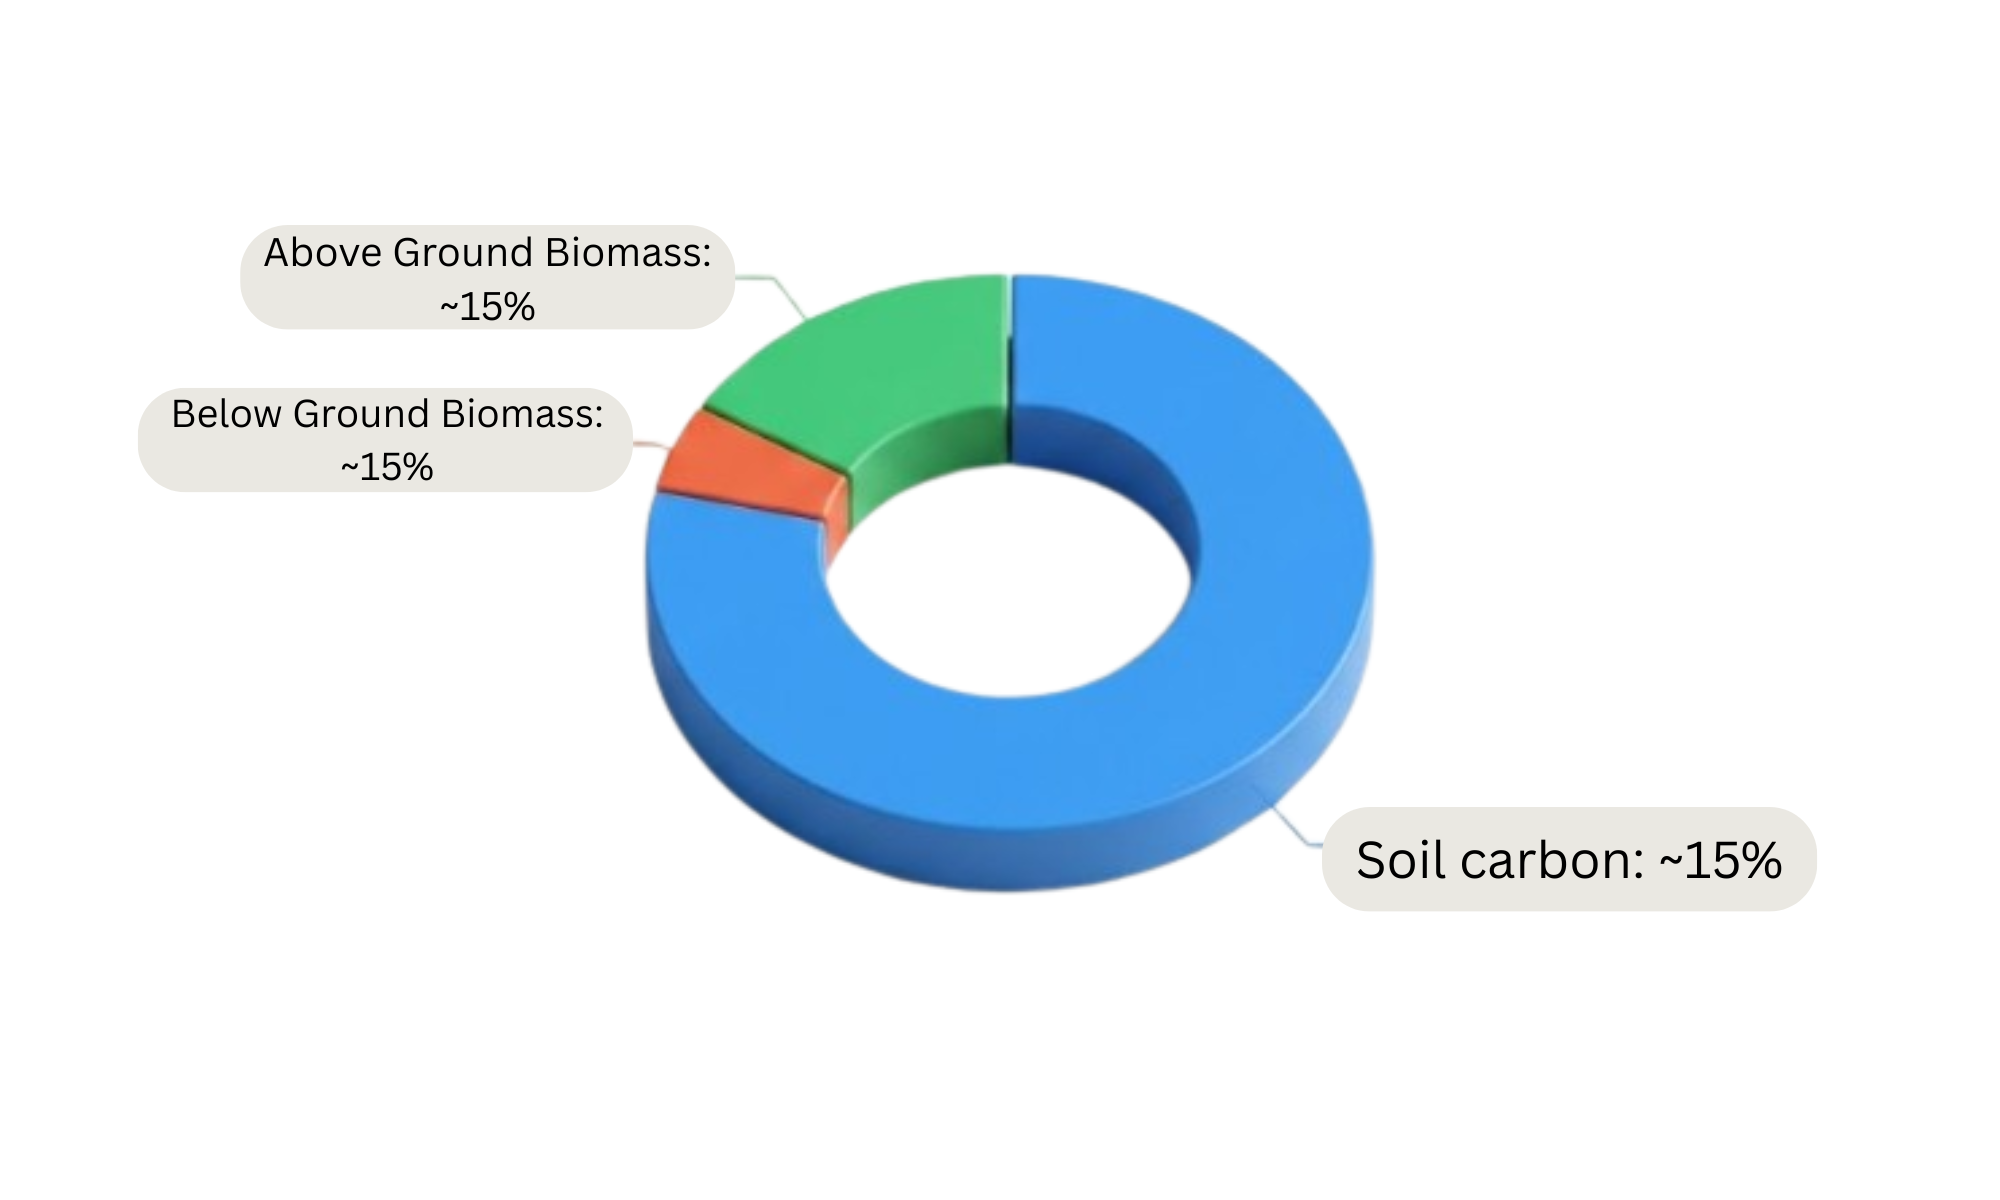
The Carbon Pool Split
• Soil: ~80% • Biomass: ~20%
Mangrove Carbon Storage Distribution
| Carbon Pool | Typical Share | Monitoring Difficulty |
|---|---|---|
| Soil Carbon | ~80% | High |
| Above-Ground Biomass | ~15% | Moderate |
| Below-Ground Biomass | ~5% | Moderate |
Why the soil pool cannot be assumed stable
Traditional projects assume that if the trees are there, the soil carbon is safe. This breaks down under sea level rise, sediment supply disruption, and salinity intrusion all of which can trigger rapid soil carbon loss without visible canopy change.
The three threats to belowground carbon stability
Major Threats to Mangrove Carbon Permanence
| Threat | Impact on Carbon | Monitoring Signal |
|---|---|---|
| Sea-Level Rise | Soil Carbon Loss | Inundation Frequency |
| Sediment Loss | Shoreline Retreat | Coastal Erosion |
| Salinity Intrusion | Vegetation Stress | Canopy Change |
- Sea level rise: Accelerating inundation can shift soils from carbon-accumulating to carbon-releasing states.
- Sediment supply disruption: Dam construction reduces sediment supply, causing shoreline retreat and substrate loss.
- Salinity intrusion: Reduced freshwater discharge exposes mangroves to lethal salinity levels, destabilising soil carbon before canopy die-back.
Monitoring this requires tracking geomorphological and hydrological conditions. Sylithe's pipeline tracks shoreline position, sediment dynamics, and inundation frequency to apply automated conservative discounts when risk thresholds are crossed.
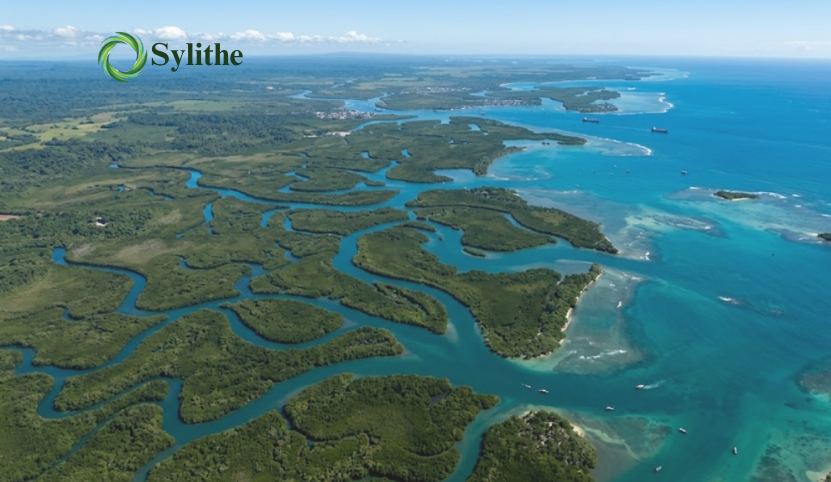
Case study: the Sundarbans climate shield
Pilot Project: Sundarbans Delta
• 500+ SAR acquisitions processed • 2,000+ Tidal data points integrated • 5 m Max tidal range modelled
The Sundarbans presents the most demanding verification environment in South Asian blue carbon. Sylithe's pipeline processed more than 500 SAR acquisitions to construct India's most accurate high-frequency mangrove biomass map.
- Restoration Success: Northern islands showed consistent positive structural signals and active canopy recruitment.
- Silent Degradation: Southern islands exposed to sea level rise showed declining coherence and shoreline retreat, triggering automatic discounts.
- Salinity Fronts: Estuarine channels showed inland migration of salinity fronts, flagging elevated stress risk for adjacent stands.
The Sundarbans pilot demonstrated that observed structural data changes the project management conversation, allowing targeted interventions where the data shows risk.
How Blue Carbon Credits Are Calculated
Blue carbon projects typically quantify carbon stored in above-ground biomass, below-ground biomass, dead organic matter, and soil carbon pools. The combined carbon stock is converted into CO₂ equivalent using internationally accepted carbon accounting methodologies.
Because soil carbon represents the largest pool in many mangrove ecosystems, accurate estimation of sediment stability and long-term permanence is often more important than canopy measurements alone.
Blue Carbon Formula
Biomass Carbon + Soil Carbon → Total Carbon Stock → CO₂e → Carbon Credits
The calculation process begins with ecosystem mapping, followed by biomass estimation, soil carbon assessment, uncertainty quantification, and permanence evaluation. Each stage contributes to the final credit volume.
Projects that demonstrate stronger monitoring quality and lower uncertainty typically retain a larger proportion of their calculated carbon stock during verification and issuance.
Why Blue Carbon Projects Are Difficult To Verify
Mangrove verification combines many of the hardest challenges in remote sensing: tidal variability, cloud cover, inaccessible terrain, soil-carbon uncertainty, and dynamic coastlines.
Unlike terrestrial forests, where canopy monitoring often dominates the workflow, blue carbon projects require simultaneous monitoring of vegetation, hydrology, sediment processes, and coastal geomorphology.
This complexity explains why verification quality varies significantly across blue carbon projects and why multi-sensor monitoring systems are becoming increasingly important.
The future of blue carbon: policy, price, and permanence
01 India's NDC and coastal carbon
India's updated NDC targets massive additional carbon sinks. Blue carbon ecosystems are increasingly recognized as critical components that will move from footnote to headline in national accounting.
02 IUCN and Verra blue carbon standards
Verra's ongoing methodology development is expected to impose higher verification standards, rewarding projects with demonstrated monitoring rigour with more defensible credit volumes.
03 Article 6 and blue carbon exports
High-integrity blue carbon verification is the prerequisite for accessing sovereign-level carbon trading markets under Article 6 ITMO transactions.
04 Co-benefit premium pricing
Mangrove credits command premiums due to coastal flood protection and biodiversity co-benefits. These premiums are entirely contingent on verification quality.
The Sylithe blue carbon pipeline: end-to-end
Data Flow
Tidal Data → Sentinel-1 SAR → Sentinel-2 Optical → LiDAR Calibration → Biomass Model → Soil Stability Analysis → Carbon Accounting → Verification Report
- Tidal harmonic integration: Building a prediction model to correct historical archives and new acquisitions.
- Multi-sensor fusion: Fusing tidal-corrected optical imagery with SAR backscatter and coherence layers.
- Aboveground biomass estimation: Applying species-specific equations to SAR-derived canopy height, calibrated with LiDAR.
- Soil carbon stability: Tracking shoreline position and sediment dynamics to apply the Soil Stability Index.
- Disturbance detection: Monitoring InSAR coherence on 12-day repeat cycles for early-stage structural alerts.
- Digital audit trail: Generating structured, timestamped records for Verra-approved verification bodies.
What high-integrity blue carbon delivers
- 3–5× Carbon density premium: Capturing ecosystem performance in credit volumes.
- Premium Voluntary market pricing: Accessing premium tiers through verification quality.
- NDC-ready: Alignment with international MRV standards and national carbon inventories.
A mangrove credit isn’t just a carbon tonne; it is a promise of coastal resilience. We provide the data that keeps that promise.
Scale Your Blue Carbon Impact
Developing a mangrove project in India, Southeast Asia, or Africa? Contact Sylithe to see how our tide-adaptive dMRV pipeline can maximise your project's integrity and valuation.
Key Takeaways & Metrics
A summary of the core concepts discussed in this article.
| Concept | Relevance | Impact Level | Status |
|---|---|---|---|
| Methodology | Core to accurate MRV | High | Active |
| Integrity | Essential for credit value | Critical | Mandatory |
| Technology | Enables scale | High | Growing |
Data synthesized from Sylithe Research.