 New
New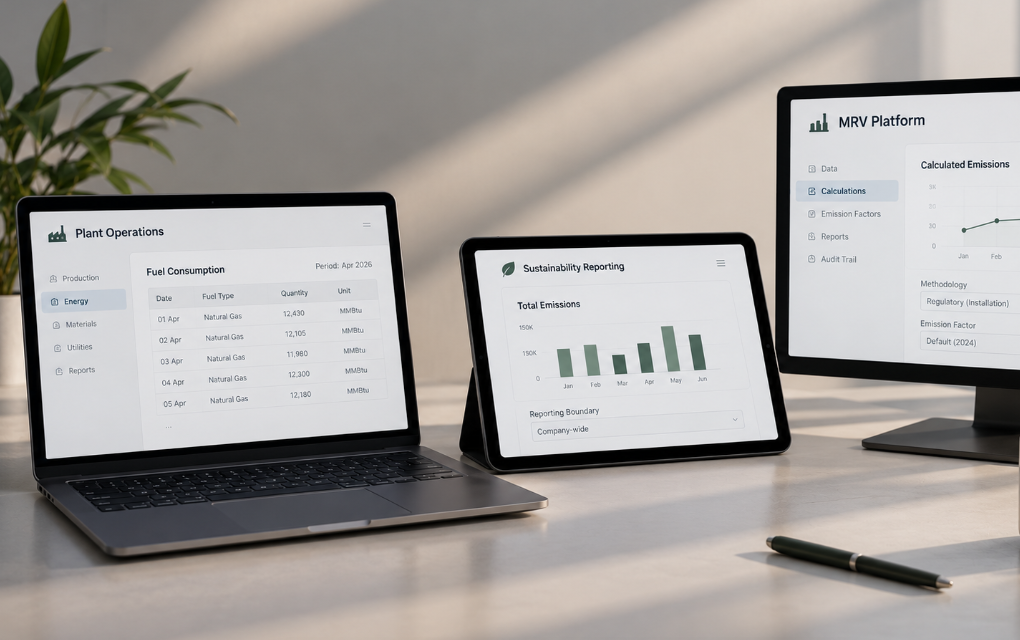
An industrial facility can have more than one emissions figure for the same reporting period.
Plant operations, the sustainability team and the MRV platform can each report a different number, and each can be individually correct. The question that matters is not which one is largest. It is which one is fit for the purpose at hand, and whether the organisation can prove why.
“The next challenge in carbon reporting is not producing a number. It is establishing the provenance and evidence that make that number defensible.”
Multiple numbers are normal
Different systems do not need to produce identical numbers to each be functioning correctly. An ERP may record purchased fuel. An emissions calculation may use fuel consumed. A regulatory MRV system may apply a prescribed methodology and a specific set of emission factors. A corporate inventory may operate under a different organisational or operational boundary than any of the above. Each of these figures can be individually correct.
- An ERP records purchased fuel, a procurement and inventory concept.
- An emissions calculation uses fuel consumed, an activity concept.
- A regulatory MRV platform applies a prescribed methodology and emission factor set, a compliance concept.
- A corporate inventory applies an organisational or operational boundary, a disclosure concept.
The presence of multiple values is not, by itself, evidence of poor data quality. The problem begins when the organisation cannot reconstruct the reason for the difference, and that distinction, between disagreement and unexplained disagreement, is what the rest of this article is about.
The U.S. Environmental Protection Agency's Inventory Management Plan (IMP) guidance, developed for its Center for Corporate Climate Leadership, makes this point operationally rather than conceptually. An IMP is expected to document an organisation's boundary conditions, quantification methodologies and emission factors, data sources and collection processes, quality assurance procedures, base-year adjustments, file maintenance responsibilities, and auditing and corrective-action procedures. In other words: the reason a number looks the way it does is treated as something an organisation is expected to be able to produce on request, not something reconstructed after the fact.
Why the numbers diverge
Different inputs
A facility records 10,000 tonnes of fuel consumption. One calculation applies a facility-specific emission factor; another applies a standard, published factor. Both calculations can be mathematically correct. The resulting emissions figures can still differ.
Which one should be used? The answer depends on the methodology governing the calculation, the intended reporting use, and whether the underlying factor is appropriate to that use and properly documented.
The GHG Protocol Corporate Accounting and Reporting Standard, developed jointly by the World Resources Institute and the World Business Council for Sustainable Development, is built around standardised approaches intended to support consistency and transparency in corporate GHG accounting. Consistency of approach is not the same claim as identity of output: two calculations can both follow the standard correctly and still arrive at different figures, because the standard governs how a calculation should be structured and disclosed, not which single factor is universally correct.
Different boundaries
A single company can also legitimately operate under several boundaries at once: an organisational boundary, an operational boundary, a regulatory installation boundary, and, increasingly, a product-level boundary. Two systems can disagree because they are measuring different things, not because either has necessarily made a calculation error.
The same emissions, viewed through different boundaries
| System | What it actually measures |
|---|---|
| Corporate inventory | The company, aggregated across multiple facilities and, depending on consolidation approach, joint ventures or subsidiaries |
| Regulatory MRV (e.g., CCTS) | A specific installation and its regulated activity, against a prescribed methodology |
| Product footprint | A single production process, attributed to a specific product rather than a facility or company |
Boundary is not a footnote to a carbon figure; it is part of what the figure means. A number reported without its boundary, like a number calculated without a stated factor, is not yet a complete number.
When divergence becomes a problem
Different inputs and different boundaries explain most disagreement between systems at a single point in time. The harder case is a number that changes over time. Activity data gets updated. An emission factor changes. A methodology is revised. A calculation formula is corrected. A reporting boundary is modified. Any one of these can change the final figure, sometimes months after it was first reported.
Unless the system retains the underlying versions, someone reviewing the report six months later sees a figure such as 98,420 tCO₂e without knowing:
- Which activity data produced it.
- Which emission factor was used.
- Which methodology version applied.
- Who changed the data.
- When it changed.
- Why it changed.
This is where data lineage becomes more consequential than the number itself. The IPCC's 2006 Guidelines for National Greenhouse Gas Inventories set out the underlying principle in its quality assurance and quality control guidance: documentation should be sufficient to allow a reviewer to understand how an estimate was derived and, in principle, reproduce it. The EPA applies this same standard operationally in compiling the U.S. national GHG inventory, stating explicitly that documentation must be maintained so that emissions calculations remain transparent and verifiable, with quality control applied at every stage of inventory development, consistent with the IPCC guidelines. A figure that cannot be traced back to its inputs does not meet that bar, regardless of whether the original calculation was correct.
The spreadsheet problem, without blaming spreadsheets
The risk does not come from spreadsheets as a tool. It emerges when a spreadsheet becomes an undocumented transformation layer sitting between systems that otherwise keep their own records.
Raw activity data is captured at the point of measurement.
The reading is logged into the operational system of record.
A manual step reconciles, aggregates or corrects the figure before it moves onward, the step most likely to leave no record of what changed or why.
The adjusted figure is ingested as if it were the original measurement.
One figure, two states
| Stage | Figure | Rule applied |
|---|---|---|
| Meter reading, logged in the ERP | 12,450 | — |
| After spreadsheet adjustment, ingested by the MRV platform | 12,180 | Undocumented |
The real question
Not simply who changed the number from 12,450 to 12,180. It is what rule transformed one figure into the other, and whether that transformation can be reconstructed.
How to establish which number is fit for purpose
There is no universal master number. A figure is not correct in some absolute sense; it is fit for purpose, meaning it satisfies the requirements of the specific accounting, regulatory, disclosure or verification use it is being put to, and can be supported by its underlying methodology and evidence.
Four questions that determine fitness for purpose
- What is being measured?
- Under which methodology?
- For which reporting boundary and period?
- What evidence supports the result?
Answering those four questions well is what a defensible carbon record actually consists of. It rests on five pillars.
The five pillars of a defensible carbon record
| Pillar | The question it answers |
|---|---|
| Provenance | Where did the underlying data originate? |
| Context | What boundary, period and activity does it represent? |
| Methodology | How was the figure calculated? |
| Lineage | What changed between the source data and the reported value, and when? |
| Evidence | Can another party retrieve the records and reconstruct the result? |
Verification is not a sixth pillar alongside these. It is the outcome of a record that holds up against all five: an independent check confirming that the provenance, context, methodology, lineage and evidence a company claims actually exist and support the reported figure.
ISO 14065:2020, General principles and requirements for bodies validating and verifying environmental information, sets out the competence, impartiality and consistent-operation requirements expected of bodies that perform that check for GHG statements; it is a sector-specific application of ISO/IEC 17029:2019, the general conformity-assessment standard those bodies also sit within. India's CCTS gives this a concrete institutional form: validation and verification activities under the scheme are carried out by Accredited Carbon Verification Agencies (ACVAs), accredited by the Bureau of Energy Efficiency against published eligibility criteria and listed in a public register. An ACVA's opinion is only as strong as the record it is checking; it cannot substitute for a record that was never properly kept.
This is consistent with the broader quality-assurance approach used in established emissions-inventory practice, where documentation, data integrity, completeness, review and reproducibility are treated as integral to inventory quality, not optional refinements applied after the fact.
Why lineage is becoming infrastructure
The useful reframing is not "companies need better carbon data." It is that companies need to know how their carbon data became the number they ultimately reported.
Data, and evidence
A number is data. Everything that lets a second party trust that number, where it came from, how it was calculated, and whether it can be reproduced, is evidence. Carbon reporting has generally been built to produce the first. It is now being asked to produce the second.
Source → Calculation → Transformation → Report → Verification. Every step in that chain should remain traceable.
That principle matters more as carbon information moves further from where it was measured.
Activity data is generated at the point of measurement.
The data is aggregated into a company-level inventory.
Methodology and emission factors produce a reportable figure.
The figure, or a certificate derived from it, is recorded centrally.
An independent body checks the figure against its supporting evidence.
The verified figure is used for compliance, trading or disclosure to a third party.
Carbon information increasingly travels across systems that were not designed together. That is the real problem: not that a number is wrong at any single stage, but that nothing guarantees the reasoning behind it survives the handoff between stages. India's CCTS is already building formal verification infrastructure through its ACVA accreditation system, and international frameworks such as ISO 14065:2020 place equivalent emphasis on independently verifiable environmental information at a global level. Neither can compensate for an evidence trail that broke two systems earlier.
“Can the same underlying emissions information remain understandable and defensible as it moves between systems that were not designed together?”
The takeaway
Carbon reporting has traditionally been treated as a calculation problem: collect activity data, apply emission factors, produce an emissions figure.
The harder problem is emerging afterwards. When that figure moves between operational systems, reporting frameworks, MRV platforms and verification processes, someone eventually has to establish why the number should be trusted.
That requires more than accuracy at the point of calculation. It requires provenance, context, methodology, lineage and evidence that survive the movement of data between systems.
"The future of carbon reporting may depend less on producing another number and more on being able to explain exactly where the number came from."
Building a carbon data trail that can survive review?
This is where digital MRV infrastructure becomes relevant: not simply to calculate emissions, but to preserve the relationship between the measurement, calculation and evidence that produced the reported figure.
Sylithe builds that layer: traceable data lineage from source measurement through to verification, so a reported figure can be explained, not just recalculated.
Sources
- World Resources Institute & World Business Council for Sustainable Development — The Greenhouse Gas Protocol: A Corporate Accounting and Reporting Standard (Revised Edition).
- International Organization for Standardization — ISO 14065:2020, General principles and requirements for bodies validating and verifying environmental information.
- International Organization for Standardization — ISO/IEC 17029:2019, Conformity assessment: General principles and requirements for validation and verification bodies.
- U.S. EPA Center for Corporate Climate Leadership — Inventory Management Plan (IMP) Guidance, Climate Leaders Greenhouse Gas Inventory Protocol.
- U.S. EPA — Inventory of U.S. Greenhouse Gas Emissions and Sinks, Annex 8: Quality Assurance and Quality Control Procedures.
- IPCC — 2006 Guidelines for National Greenhouse Gas Inventories, Volume 1, Chapter 8: Quality Assurance and Quality Control.
- Bureau of Energy Efficiency, Government of India — List of Accredited Carbon Verification Agency empanelled under CCTS.
The framing of provenance, context, methodology, lineage and evidence as five pillars of a defensible carbon record, and the positioning of verification as their outcome rather than a sixth attribute, reflect Sylithe Research's synthesis of the primary standards above rather than a position taken by any single standards body.
Standards and guidance documents referenced here are periodically revised. Figures, requirements and institutional roles described in this article should be checked against the current published version of each source before being relied upon for compliance or reporting decisions.