 New
New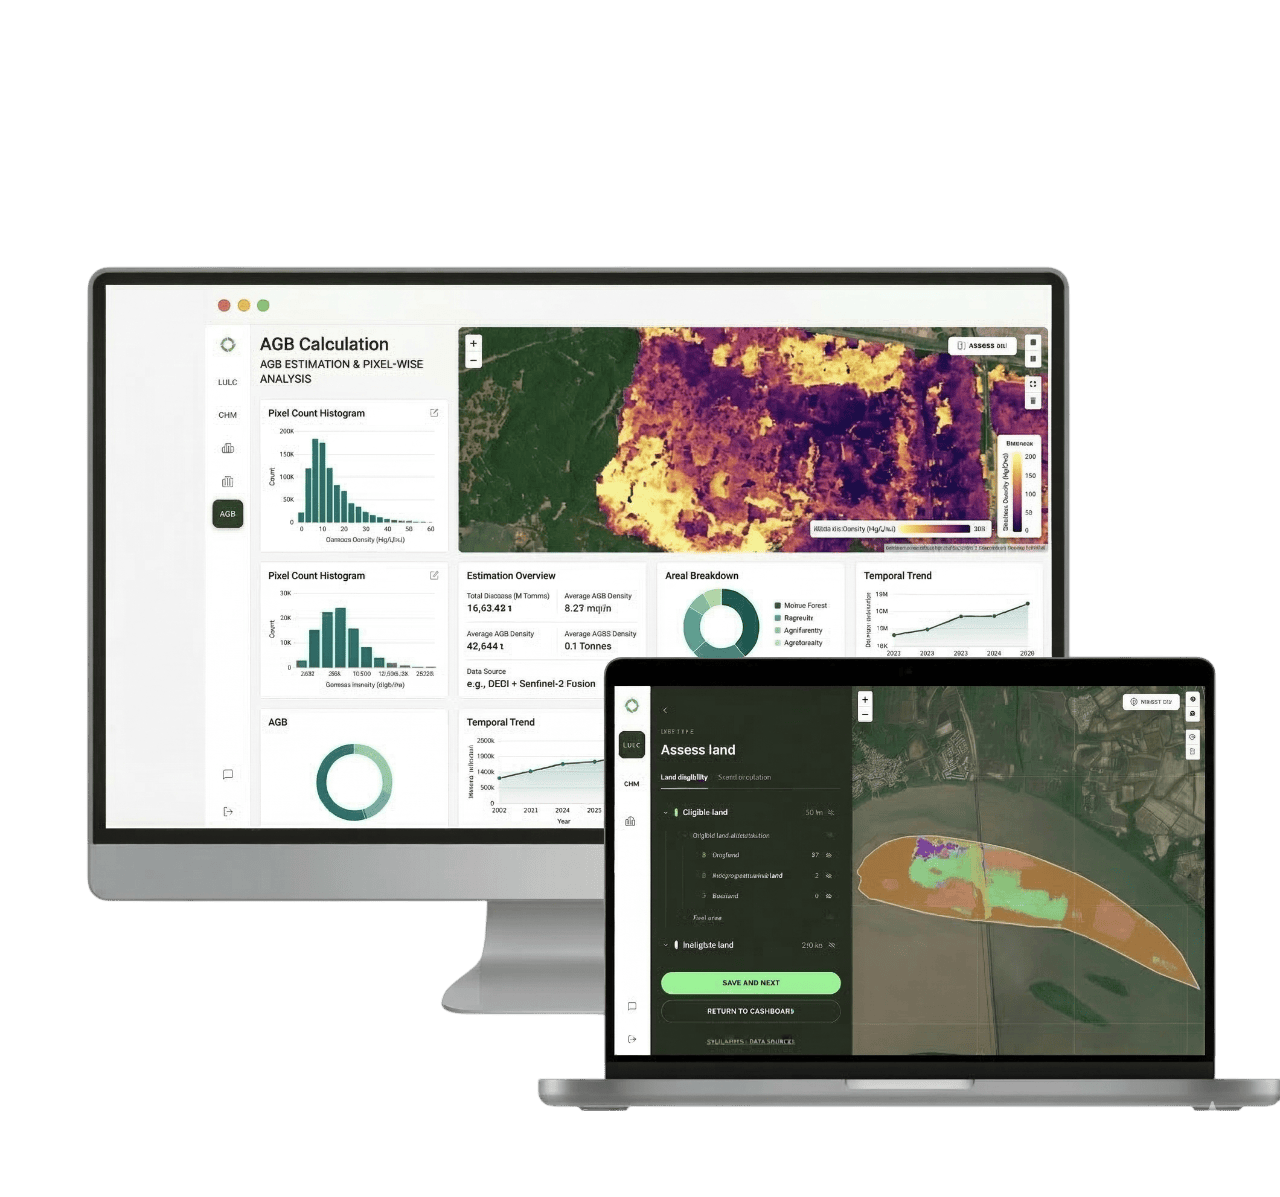
A carbon credit is only as credible as the monitoring system behind it. In nature-based carbon markets, digital MRV is becoming the difference between trusted credits and questioned ones.
For most of climate finance history, emissions reduction projects dominated carbon markets. Renewable energy, industrial efficiency and fuel-switching initiatives formed the backbone of carbon credit issuance globally. That reality is changing rapidly. Nature-based solutions have emerged as one of the fastest-growing segments of voluntary and compliance carbon markets. Governments, corporations, investors and multilateral institutions increasingly recognize that climate mitigation cannot be achieved through emission reductions alone.
Forests, agroforestry systems, mangroves, grasslands, wetlands and restored ecosystems now represent some of the most valuable carbon assets on Earth. These ecosystems remove carbon from the atmosphere while simultaneously delivering biodiversity protection, water security, soil health and community co-benefits. But the growth of nature-based carbon projects has introduced a fundamental question: how do you accurately measure, monitor, report and verify environmental change across landscapes spanning thousands — or millions — of hectares?
Why Measurement Is the Foundation of Carbon Markets
A carbon credit represents a quantified climate outcome. Before a credit can be issued, sold, retired or used for compliance, the underlying environmental impact must be demonstrated with a reasonable degree of scientific confidence. This process depends entirely on measurement.
Without robust measurement, carbon sequestration cannot be quantified, additionality cannot be demonstrated, permanence cannot be assessed, leakage cannot be monitored, and verification cannot occur. The quality of a carbon market ultimately depends on the quality of the measurement systems supporting it. As markets mature, buyers are evaluating not only the quantity of credits generated by a project but also the quality of the monitoring infrastructure behind them.
- Additionality: Would the carbon benefit have occurred without the project?
- Permanence: Will the carbon stay stored over the crediting period?
- Leakage: Does the project cause carbon loss elsewhere?
- Carbon stock quantification: How much carbon is actually sequestered?
- Verification: Can an independent third party confirm all of the above?
What Are Nature-Based Carbon Projects?
Nature-based solutions (NbS) leverage ecosystems to store carbon, reduce emissions and deliver biodiversity and community co-benefits. Within carbon markets, four project types dominate the NbS landscape: Afforestation, Reforestation and Revegetation (ARR); Reducing Emissions from Deforestation and Forest Degradation (REDD+); Improved Forest Management (IFM); and agroforestry.
Each project type operates differently, targets different landscape dynamics and requires different monitoring approaches. Understanding these differences is essential for designing effective digital MRV systems.
Carbon Removal vs. Avoided Emissions
NbS projects fall into two broad categories. Removal projects — like ARR and agroforestry — actively sequester carbon from the atmosphere through ecosystem growth. Avoided-emissions projects — like REDD+ and IFM — prevent carbon that is currently stored in ecosystems from being released. Both types generate carbon credits, but they differ in how monitoring systems must track and quantify their climate outcomes.
Why Institutional Buyers Prefer High-Integrity NbS
Corporate buyers purchasing nature-based credits increasingly seek projects backed by transparent, continuous monitoring evidence. Following the voluntary carbon market integrity controversies of 2023–2024, buyers and their advisors scrutinize the monitoring infrastructure behind credits as closely as the credit volume itself. Projects capable of demonstrating robust, satellite-backed dMRV evidence are increasingly preferred over those relying on periodic field surveys alone.
The Evolution of Carbon Monitoring: From Field Surveys to Satellite Intelligence
Traditional MRV: How It Works
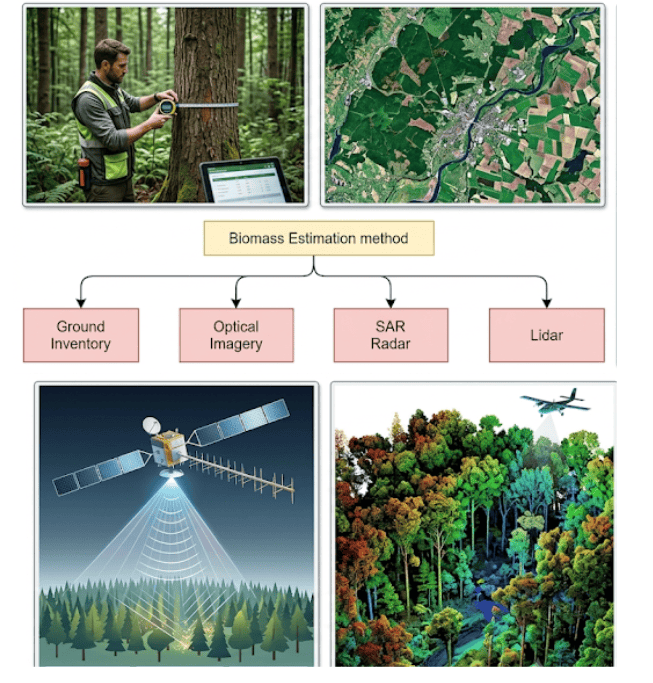
Traditional MRV relies on field surveys conducted within statistically representative sample plots distributed across the project area. Field teams physically measure tree diameter, height and species composition, which are then converted into biomass estimates using allometric equations. These measurements are typically conducted every 3–5 years and extrapolated across the entire project landscape.
- Field surveys of permanent sample plots (typically 0.5–2% coverage)
- Manual tree measurements: diameter at breast height (DBH), height, species
- Allometric equations to convert measurements to biomass
- Carbon fraction application to estimate CO₂ equivalent
- Periodic third-party verification audits
Why Traditional MRV Is Reaching Its Limits
Traditional approaches remain scientifically valuable but face serious constraints at scale. Modern nature-based carbon projects may span hundreds of thousands of hectares across remote and difficult terrain. Field surveys in these contexts are expensive, logistically complex and inherently limited in spatial coverage. Most critically, periodic monitoring — conducted once every few years — creates temporal blind spots during which significant ecological events can occur undetected.
Traditional MRV vs. Digital MRV
Comparing monitoring approaches across key dimensions.
| Dimension | Traditional MRV | Digital MRV |
|---|---|---|
| Spatial coverage | 0.5–2% sample plot coverage | Wall-to-wall 100% coverage |
| Temporal frequency | Every 3–5 years | Weekly to monthly satellite revisits |
| Cost per hectare | High — labour, logistics, lab | Low — cloud-scale processing |
| Transparency | Audit reports, limited data access | Reproducible data pipelines |
| Change detection | Detected at next audit cycle | Near-real-time alerts |
| Scalability | Limited by field capacity | Scales to millions of hectares |
The spatial problem is worse than the coverage figure suggests, because forest loss is rarely random. Clearing tends to start near roads, settlements and agricultural edges, and sparse sample plots can miss those patterns entirely while still producing a statistically tidy estimate. Between audit cycles the project is effectively unobserved, so credits issued in year two or three describe a forest that has not been formally checked since the last field campaign.
What Is Digital MRV (dMRV)?
Digital MRV combines satellite imagery, remote sensing, AI-powered analytics, cloud computing and automated reporting workflows into a continuous environmental intelligence system. Unlike traditional approaches that observe only a small sample of a project area at infrequent intervals, dMRV systems provide wall-to-wall coverage, frequent temporal updates and transparent, reproducible evidence generation.
The transition from periodic audits to continuous monitoring represents one of the most important technological shifts in the history of carbon markets. Rather than asking "what happened to this forest?" during a five-year audit cycle, dMRV systems answer "what is happening to this forest?" on an ongoing basis.
The dMRV Workflow
Multi-satellite data streams — optical (Sentinel-2, Landsat), radar (Sentinel-1), and structural (GEDI LiDAR) — are ingested continuously across the project area.
Cloud-based geospatial processing pipelines apply atmospheric correction, cloud masking, time-series compositing and spectral analysis to transform raw satellite data into analysis-ready products.
Machine learning biomass models combine satellite observations with terrain, climate and soil data to estimate above-ground biomass and carbon stocks across the entire project landscape.
Change detection algorithms continuously scan for deforestation, degradation, fire, encroachment and other disturbances, triggering near-real-time alerts when anomalies are detected.
Automated reporting workflows compile monitoring data into structured MRV reports aligned with verified carbon standard requirements.
Transparent, reproducible data pipelines allow third-party verifiers to independently check all evidence rather than relying on project-submitted field reports alone.
"Digital MRV does not replace field surveys. It transforms the role of field surveys — from the primary evidence source to a calibration and validation layer within a satellite-first monitoring architecture."
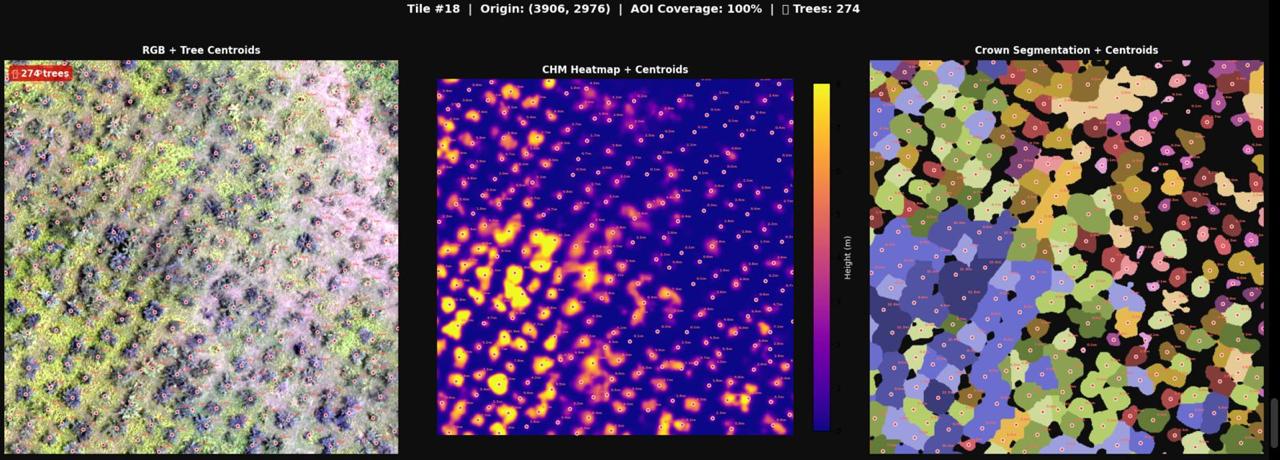
Why Nature-Based Projects Need Continuous Monitoring
Nature-based projects are fundamentally different from industrial carbon projects. A solar installation behaves predictably. A forest does not. Trees grow. Trees die. Fire occurs. Illegal logging happens. Floods alter ecosystems. Drought affects biomass accumulation. Land-use pressure evolves continuously. Because nature itself is dynamic, monitoring systems must also be dynamic.
Periodic observations separated by multiple years create monitoring blind spots that introduce significant uncertainty into project performance assessments. Continuous satellite monitoring reduces those blind spots and enables earlier detection of both opportunities and risks — enabling project developers and buyers to respond before problems become irreversible.
Digital MRV for ARR Projects
What Are ARR Carbon Projects?
Afforestation, Reforestation and Revegetation (ARR) projects generate carbon credits by establishing or restoring tree cover on land that was previously deforested, degraded or devoid of forest. Afforestation refers to tree planting on land that has not been forested for at least 50 years. Reforestation restores forests on recently deforested land. Revegetation covers a broader range of vegetation restoration activities on degraded lands.
ARR projects are among the most widely recognized nature-based project types because they create measurable carbon removals while generating biodiversity, soil health and watershed co-benefits. They are also among the most technically complex to monitor, because developers must track ecological change across an entire growth trajectory — from bare land through canopy closure to mature forest.
Monitoring Challenges in ARR Projects
- Baseline establishment: Documenting pre-project land cover and carbon stocks
- Land eligibility verification: Proving the area was not forested at the baseline date
- Tree survival monitoring: Tracking which planted trees have survived across the project area
- Biomass accumulation: Measuring carbon stock growth through every growth stage
- Leakage monitoring: Detecting if agricultural pressure has shifted to adjacent areas
- Permanence risk: Identifying fire, drought and mortality threats before they become losses
How Digital MRV Supports ARR
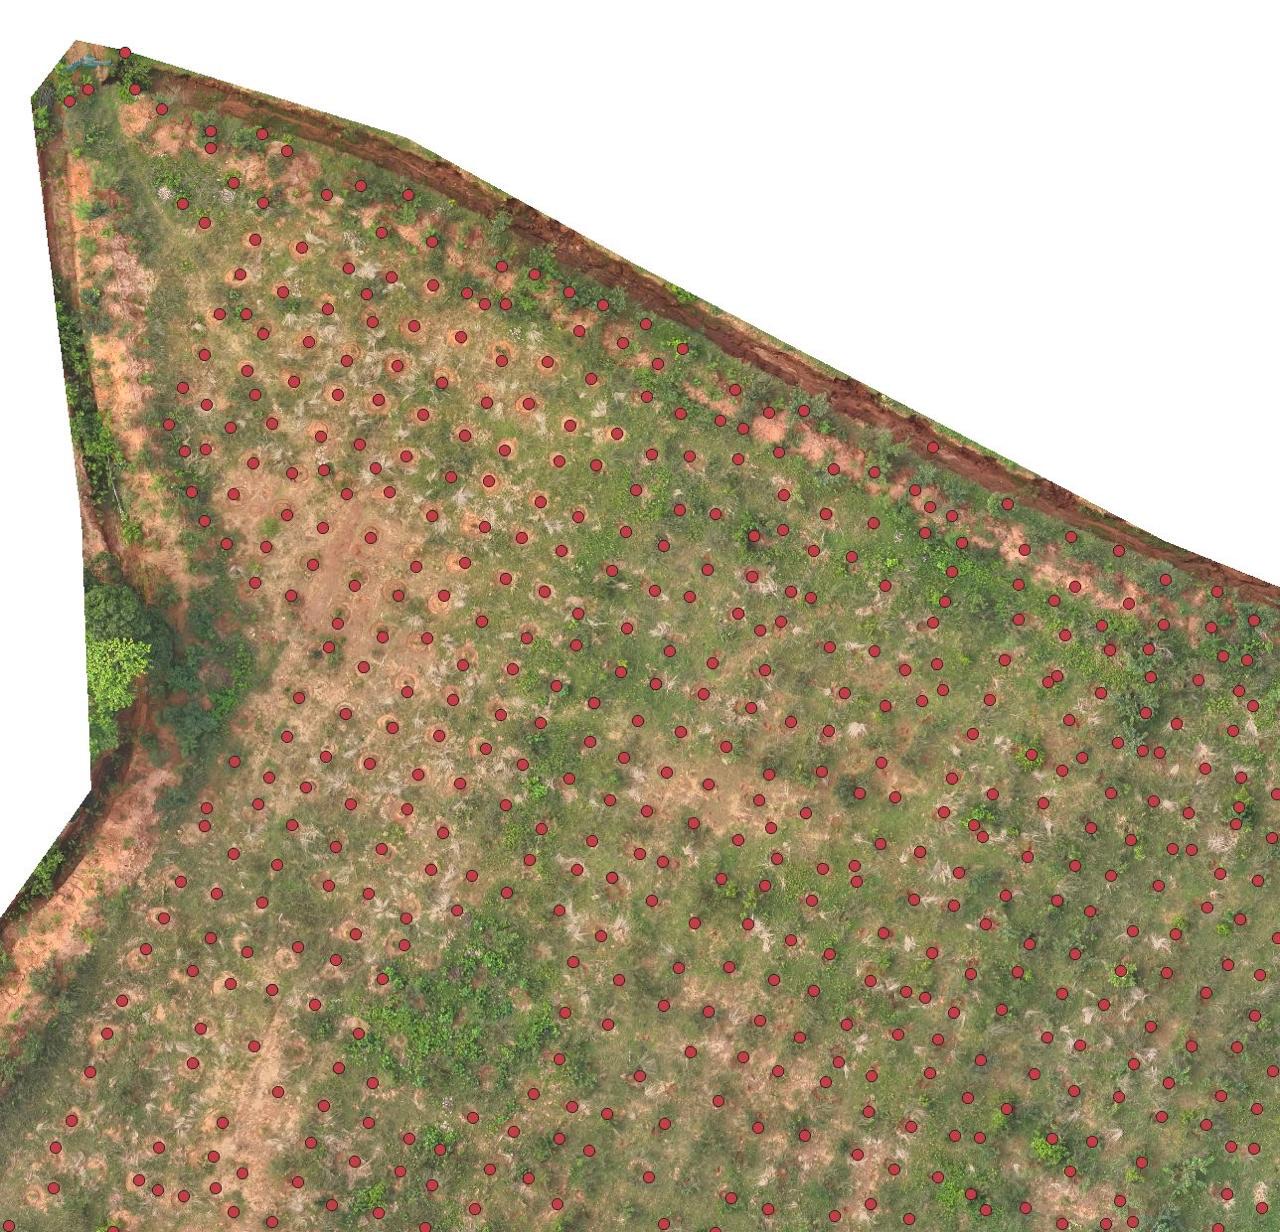
For ARR projects, dMRV provides continuous visibility across the entire crediting period. Satellite time series allow developers to document pre-project land cover conditions with historical imagery, establish baseline carbon stocks, track vegetation establishment and canopy development, monitor biomass accumulation through repeated vegetation index measurements, and detect disturbances including fire, flooding and mortality events.
Growth tracking through multi-temporal NDVI and canopy height models enables continuous biomass estimation without requiring annual field campaigns. This dramatically reduces monitoring costs while improving the spatial resolution and completeness of monitoring evidence. Instead of extrapolating from sample plots, dMRV provides per-hectare monitoring across the entire project area.
ARR Monitoring Requirements and dMRV Solutions
How digital MRV addresses each major monitoring requirement for ARR projects.
| Monitoring Requirement | Traditional Approach | Digital MRV Approach |
|---|---|---|
| Baseline land cover | Historical field records | Multi-decade satellite time series |
| Tree survival | Annual field counts (sample) | High-res imagery analysis (full area) |
| Biomass growth | Sample plot allometry (3–5 yrs) | Continuous NDVI + canopy height |
| Fire detection | Post-event field surveys | Near-real-time thermal anomaly alerts |
| Leakage monitoring | Periodic adjacent surveys | Continuous change detection in buffer zones |
ARR Risk Intelligence
Fire, drought, and poor survival rates are the three most common reasons ARR projects underperform against projections. Digital MRV enables early warning systems for each of these risks — allowing project managers to respond before small problems become large credit losses.
Digital MRV for REDD+ Projects
What Is REDD+?
REDD+ — Reducing Emissions from Deforestation and Forest Degradation — is one of the largest and most established segments of the voluntary carbon market. REDD+ projects generate carbon credits by protecting forests that would otherwise be deforested or degraded, thereby avoiding the emissions that deforestation would have released. The "+" in REDD+ also encompasses sustainable forest management and enhancement of forest carbon stocks.
REDD+ projects can be broadly categorized as avoided deforestation (protecting forests from conversion to agriculture or development), avoided degradation (preventing selective logging, charcoal production and other degradation activities), conservation (protecting biodiversity and high-carbon forest ecosystems), and sustainable forest management (improving management practices within commercial forests).
Why REDD+ Requires Advanced Monitoring
REDD+ is uniquely challenging to monitor because projects must prove a counterfactual: that deforestation or degradation would have occurred without the project. This requires establishing a credible baseline that reflects what would likely have happened in the absence of intervention — a task that is inherently complex and contested.
Monitoring requirements for REDD+ projects include deforestation detection (identifying forest loss events and their timing), forest degradation assessment (detecting logging, burning or other sub-canopy damage), baseline modelling (estimating historical deforestation rates in reference areas), leakage assessment (monitoring displacement of deforestation pressure), and risk monitoring (tracking threats including agriculture, encroachment, and fire).
How Satellites Transform REDD+ Verification
Satellite monitoring has fundamentally transformed REDD+ verification. Before satellite-based monitoring became widespread, REDD+ verification relied heavily on project-submitted field reports and limited remote sensing analysis conducted by auditors. This created information asymmetry between project developers, who had detailed on-ground knowledge, and verifiers and buyers, who had limited independent monitoring capability.
Modern dMRV systems eliminate much of this asymmetry. Continuous satellite observation of the project area and surrounding landscape allows independent monitoring of forest cover change, creating a transparent, third-party-verifiable evidence base. Near-real-time deforestation alerts enable verifiers to track project performance in close to real time, rather than discovering problems only during periodic audits.
- Continuous forest observation: Wall-to-wall monitoring using multi-sensor satellite data
- Near-real-time alerts: Deforestation events detected within days of occurrence
- Dynamic baselines: Continuously updated reference area monitoring
- Degradation detection: Sentinel-1 radar identifies selective logging through canopy disruption
- Risk intelligence: AI-driven threat assessment combining pressure maps and change detection
"The voluntary carbon market's 2023 integrity crisis was, at its core, a monitoring crisis. Projects that overstated their impact did so in the space created by infrequent, limited monitoring. Continuous satellite-based dMRV closes that space."
Digital MRV for Improved Forest Management (IFM)
Understanding IFM Projects
Improved Forest Management (IFM) projects generate carbon credits by increasing the carbon stored within managed forests through better management practices. IFM operates within forest landscapes that are already commercially managed — the carbon benefit comes from changing how that management occurs, not from stopping it entirely.
Common IFM approaches include reduced-impact logging (minimizing collateral damage during timber harvesting), extended harvest rotations (allowing trees to grow longer before harvest, accumulating more carbon), improved conservation management (protecting high-carbon areas within managed forests), and enhanced regeneration strategies (supporting natural forest recovery between harvest cycles).
Monitoring Requirements for IFM
IFM projects often operate within existing forest landscapes where carbon stocks are already substantial. Monitoring requires detailed understanding of forest structure and biomass dynamics at a level of resolution that traditional field surveys struggle to achieve cost-effectively across large areas.
- Forest structure: Canopy height, vertical structure and forest type mapping
- Canopy height: Tracking changes in tree height as a proxy for biomass accumulation
- Biomass density: Estimating above-ground biomass per hectare across the project area
- Carbon stock change: Quantifying the difference between project and baseline carbon trajectories
- Disturbance monitoring: Detecting harvesting events, natural disturbances and illegal activities
Why IFM Projects Benefit From dMRV
IFM monitoring using GEDI LiDAR canopy height models represents one of the most significant recent advances in forest carbon measurement. LiDAR-derived canopy height measurements can be combined with optical satellite data to produce wall-to-wall biomass maps at unprecedented spatial resolution — reducing reliance on field plot extrapolation and improving the accuracy of carbon stock estimates.
For IFM projects, dMRV also improves harvest monitoring. By comparing pre- and post-harvest canopy height models, dMRV systems can quantify the carbon impact of each harvest event across the entire project area — providing a level of monitoring precision that field surveys cannot match. This capability is particularly valuable for demonstrating the carbon benefit of reduced-impact logging versus conventional harvesting practices.
Digital MRV for Agroforestry Carbon Projects
Why Agroforestry Is Emerging as a Major Carbon Opportunity
Agroforestry systems integrate trees with agricultural production across smallholder farms, commercial agricultural estates and pastoral landscapes. These systems offer significant carbon sequestration potential while simultaneously improving soil health, agricultural productivity, biodiversity and climate resilience. Agroforestry is particularly important in countries like India, Ethiopia, Brazil and Indonesia, where agricultural landscapes occupy vast areas and support hundreds of millions of livelihoods.
The carbon potential of agroforestry has historically been undervalued due to monitoring complexity. Unlike homogeneous forest stands or plantation blocks, agroforestry systems are highly heterogeneous — combining food crops, cash crops and diverse tree species in variable densities across fragmented smallholder landscapes.
Monitoring Challenges in Agroforestry
- Seasonal variability: Crop cycles create continuously changing vegetation signatures
- Mixed land-use systems: Trees, crops and bare soil coexist within single farm parcels
- Tree density variation: Individual farm tree counts vary enormously across the project area
- Carbon estimation complexity: Species diversity requires multiple allometric models
- Smallholder scale: Individual farms may be under 1 hectare, requiring sub-metre resolution data
How Digital MRV Supports Agroforestry
Digital MRV addresses agroforestry monitoring challenges through multi-temporal analysis that separates tree canopy from crop signals across seasonal cycles. High-resolution satellite imagery enables tree detection and canopy mapping at the individual farm level. Machine learning models trained on agroforestry-specific spectral signatures can distinguish trees from crops even in complex mixed-land-use environments.
For smallholder agroforestry projects, dMRV dramatically reduces the monitoring cost per farmer by replacing farm-by-farm field visits with landscape-scale satellite analysis. This cost reduction is critical for project viability — monitoring costs that consume 30–50% of credit revenue in traditional systems can be reduced to under 10% with satellite-first architectures, making smallholder participation economically feasible.
The Technology Stack Behind Modern dMRV
Modern digital MRV systems combine multiple technologies rather than relying on a single data source. Each technology contributes different observational capabilities — together forming a comprehensive environmental intelligence architecture.
Satellite Monitoring
Satellite Data Sources for Carbon Monitoring
Key satellites and their roles in nature-based carbon project monitoring.
| Satellite | Type | Resolution | Key Carbon Use |
|---|---|---|---|
| Sentinel-2 | Optical multispectral | 10m | Canopy cover, NDVI, land-cover change |
| Sentinel-1 | SAR radar | 10m | All-weather monitoring, degradation detection |
| Landsat 8/9 | Optical multispectral | 30m | Long-term baseline, historical time series |
| PlanetScope | Optical high-frequency | 3m | Daily change detection, tree survival |
| GEDI LiDAR | Spaceborne LiDAR | 25m shots | Canopy height, above-ground biomass |
Structural Measurements: LiDAR and Canopy Height
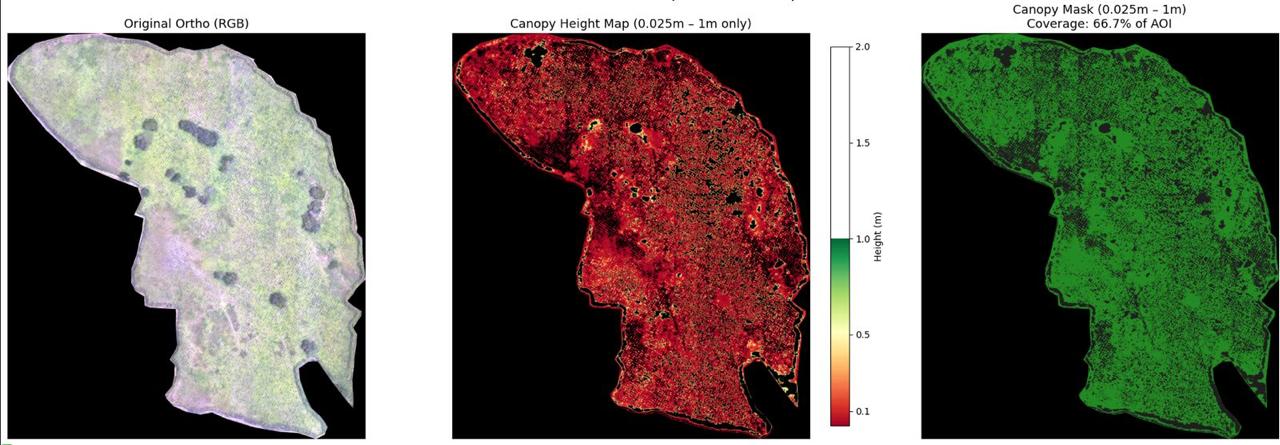
NASA's Global Ecosystem Dynamics Investigation (GEDI) instrument aboard the International Space Station provides spaceborne LiDAR measurements that are revolutionizing forest structure monitoring. GEDI waveforms measure canopy height with high precision, enabling above-ground biomass estimation at spatial scales that were previously impossible without intensive field campaigns. Canopy Height Models derived from GEDI data, combined with optical satellite imagery, produce wall-to-wall biomass maps at unprecedented resolution.
Environmental Intelligence Layers
Beyond vegetation monitoring, modern dMRV systems integrate terrain data (digital elevation models for topographic correction and watershed analysis), climate layers (precipitation, temperature, evapotranspiration for environmental context and risk modeling), soil data (organic carbon content, texture and drainage for biomass model calibration), and risk layers (deforestation pressure maps, fire risk models, encroachment probability assessments) to provide a comprehensive picture of project context.
Biomass Estimation: The Foundation of Carbon Accounting
Carbon cannot usually be directly observed from space. Instead, carbon accounting relies on measurable ecological indicators that correlate with biomass and carbon storage. Biomass estimation therefore serves as the scientific bridge between environmental observations and carbon credit quantification.
Above-Ground Biomass (AGB)
Above-ground biomass refers to all living plant material above the soil surface — including trunks, branches, leaves and bark. AGB is typically the largest and most precisely measurable carbon pool in forest, ARR and agroforestry projects. Digital MRV estimates AGB using satellite-derived vegetation indices, canopy height models and machine learning models trained on field plot measurements. Carbon content is calculated by multiplying AGB by a carbon fraction (typically 0.47 for forest biomass, following IPCC guidelines).
Below-Ground Biomass (BGB)
Below-ground biomass — root systems and associated organic material — is rarely measured directly in large-scale projects. Instead, it is typically estimated using root-to-shoot ratios derived from ecosystem-type lookup tables, following IPCC Tier 1 or Tier 2 methodology. BGB typically represents 15–25% of total biomass in tropical forests, making it a significant carbon pool that cannot be ignored in project accounting.
Improving Biomass Accuracy Through Sensor Fusion
The most accurate biomass estimates emerge from sensor fusion architectures that combine multiple data sources. Optical satellite reflectance provides vegetation index information. LiDAR-derived canopy height provides vertical structure information. Radar backscatter provides information on vegetation moisture and forest density. Machine learning models trained on co-located field plot measurements learn how these signals combine to predict biomass across diverse forest types.
Technical Insight: Uncertainty Quantification
Every biomass estimate carries uncertainty. High-integrity dMRV systems do not simply report a single carbon stock number — they report a probability distribution with confidence intervals. Conservative accounting methodologies apply uncertainty discounts to credit claims, ensuring that only statistically robust carbon estimates are used for credit issuance.
Dynamic Baselines and Additionality
Why Baselines Matter
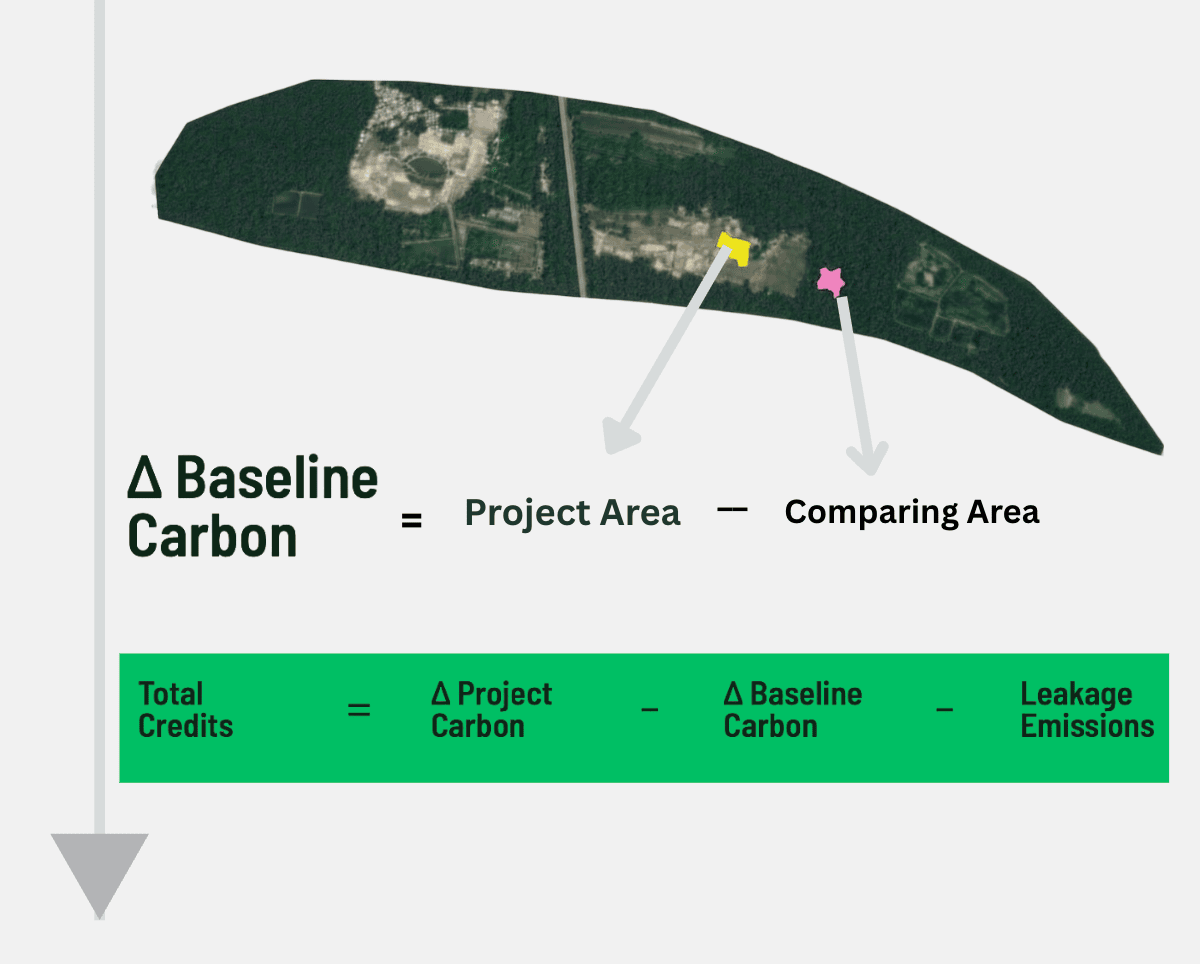
A carbon project baseline defines what would have happened to the landscape in the absence of the project intervention. For REDD+ projects, the baseline represents the amount of deforestation that would have occurred without protection. For ARR projects, it represents the carbon stocks that would have existed without tree planting. The baseline determines how many emission reductions or removals are additional — and therefore how many credits can be generated.
Problems With Static Baselines
Traditional static baselines are calculated once — typically using historical deforestation rates from a reference period — and applied across the entire crediting period, which may span 20–40 years. Static baselines create serious integrity problems because deforestation rates change over time. A baseline derived from a high-deforestation historical period may overstate what would have occurred during a later period when deforestation pressure had already declined — overstating additionality and inflating credit volumes.
Dynamic Control Area Baselines (DCAB)
Dynamic Control Area Baselines address this problem by continuously monitoring a set of reference areas — similar landscapes that did not receive project interventions — and using their observed change rates to update project baselines over time. If deforestation declines across the reference landscape, the project baseline is adjusted downward. If deforestation accelerates, it is adjusted upward. This approach produces baselines that reflect current landscape conditions rather than historical averages.
Calculated once using historical data. Cannot reflect changes in deforestation pressure. Risk of inflation when historical rates are higher than current rates. Preferred by some project developers for predictability.
Continuously updated using satellite-monitored reference areas. Reflects current landscape conditions. Reduces manipulation risk and improves buyer confidence. Preferred by high-integrity carbon market participants.
Carbon Project Risks That Must Be Monitored
Nature-based carbon projects face a range of physical, biological and socioeconomic risks that can threaten credit integrity. Digital MRV systems provide early warning capabilities for each of these risk categories — enabling project managers and buyers to identify threats before they become irreversible credit losses.
Key Risk Categories and dMRV Detection Methods
How digital MRV monitors and detects each major risk type.
| Risk Type | Impact | dMRV Detection Method | Detection Speed |
|---|---|---|---|
| Deforestation | Permanent credit reversal | Satellite change detection | Days |
| Fire | Biomass and credit loss | Thermal anomaly + NDVI change | Hours to days |
| Encroachment | Gradual forest loss | High-res imagery analysis | Days to weeks |
| Drought | Biomass stress and mortality | NDVI decline + moisture indices | Weeks |
| Leakage | Displacement of emissions | Buffer zone monitoring | Weeks |
| Reversal | Loss of stored carbon | Multi-parameter monitoring | Variable |
Fire risk monitoring deserves particular attention. Fire is one of the most significant threats to forest carbon projects, capable of destroying decades of carbon accumulation in a single event. Near-real-time thermal anomaly detection — available through MODIS, VIIRS and Sentinel-3 satellites — can identify active fire events within hours of ignition, enabling rapid response. Post-fire biomass assessment using change detection algorithms quantifies credit losses and triggers buffer pool deductions automatically.
Why Buyers Are Demanding Better Monitoring
The integrity crisis that struck the voluntary carbon market in 2023–2024 fundamentally altered buyer behavior. Investigation reports revealing that some REDD+ projects had significantly overstated their avoided emissions impact — with some studies suggesting over-crediting rates of 50–90% for certain project types — triggered a dramatic reassessment of how buyers evaluate carbon credit quality.
Institutional buyers — corporations, financial institutions, sovereign entities — now increasingly require projects to demonstrate not just credit volume but the quality of underlying monitoring systems. The questions have shifted from "how many credits does this project generate?" to "how do you know?" and "can I verify that independently?".
- Transparency: Independent access to raw monitoring data and analysis workflows
- Auditability: Reproducible evidence trails that third parties can independently check
- Continuity: Near-real-time monitoring rather than periodic audit snapshots
- Conservatism: Honest uncertainty quantification and conservative credit accounting
- Responsiveness: Rapid detection and disclosure of reversal events
As carbon credits increasingly function as financial assets — held on corporate balance sheets, used in regulatory compliance, traded on exchanges and scrutinized by ESG rating agencies — the standards applied to carbon monitoring are converging toward those applied to financial auditing. Projects built on robust dMRV infrastructure are better positioned to meet these rising standards.
Digital MRV and the Future of Verification
The trajectory of carbon market verification is clear: from reports to evidence, from sample plots to landscape intelligence, from periodic audits to continuous monitoring, from estimates to confidence intervals, and from carbon credits to carbon intelligence. Each transition represents a shift toward greater transparency, greater scientific rigor and greater buyer confidence.
Periodic third-party audit cycles. Project-submitted field reports as primary evidence. Limited independent monitoring capacity. Significant information asymmetry between developers and buyers.
Continuous satellite-based monitoring integrated with verification workflows. Transparent, reproducible evidence trails. Independent monitoring as standard practice. Real-time performance visibility for buyers and regulators.
Article 6 of the Paris Agreement — which governs international carbon trading between countries — is also driving higher monitoring standards. Article 6.4 projects must meet robust MRV requirements, and countries are increasingly recognizing that high-integrity domestic carbon markets require continuous monitoring infrastructure as a foundational element. India's Carbon Credit Trading Scheme (CCTS) represents a particularly significant opportunity: as India develops domestic methodologies for nature-based projects, the monitoring standards embedded in those methodologies will determine whether Indian NbS credits gain international acceptance.
Digital Twins: A Continuously Updated Record of the Project
A digital twin is a continuously updated model of a specific project area, holding canopy height, density and land-cover classification for every pixel, with each satellite overpass adding a new observation. Instead of a static report, the buyer and verifier can inspect an evidence trail showing what was observed, when, and by which sensor.
- Structural representation: canopy height and density modelled across the whole project area, not just sample plots.
- Continuous updating: every satellite overpass extends the time series, so disturbances show up between audits.
- Audit trail: each classification decision and change event is logged with the source satellite and acquisition time.
- Compliance readiness: regulators and buyers increasingly expect reproducible evidence chains and clear data provenance.
Decoupling Monitoring Cost From Project Size
Field verification costs scale with area: more hectares mean more plots, more travel and more crew days. Satellite monitoring runs on shared infrastructure, so the marginal cost of observing another hectare or another project is small. That shift matters most for small community and smallholder projects, where verification costs have historically consumed too much of the credit revenue. It also lets buyers and developers assess risk across a whole portfolio rather than project by project.
Why the Future of Nature-Based Carbon Projects Depends on dMRV
Across every nature-based project type, the same dynamic is emerging: monitoring quality is becoming a primary determinant of credit quality. Projects that demonstrate robust, transparent and continuous monitoring evidence attract premium buyers, secure stronger verification outcomes and maintain long-term market credibility.
- ARR: Continuous growth tracking and disturbance monitoring across the full crediting period
- REDD+: Near-real-time deforestation detection and dynamic baseline management
- IFM: Forest structure monitoring and harvest impact quantification at landscape scale
- Agroforestry: Multi-temporal tree canopy mapping across heterogeneous smallholder landscapes
- Article 6 transactions: Internationally recognized, transparent evidence for corresponding adjustments
- CCTS: Domestic methodology compliance and future international market access
- Corporate climate commitments: Auditable evidence for Science-Based Targets alignment
"The next generation of nature-based carbon projects will not simply measure environmental outcomes. They will continuously observe them, continuously verify them, and continuously prove them."
Conclusion: From Carbon Claims to Carbon Intelligence
Nature-based solutions represent one of the most powerful tools available for climate mitigation. Forests, restored ecosystems and agroforestry systems can sequester enormous quantities of carbon while delivering biodiversity, water security and community co-benefits that no industrial project can replicate. But realizing this potential depends on one thing: the ability to measure, monitor and verify what is actually happening on the ground — continuously, transparently and at scale.
Digital MRV is not a future technology. It exists today, powered by freely available satellite data from Sentinel and Landsat missions, open-source geospatial processing frameworks, and increasingly accessible machine learning tools. What separates high-integrity projects from questionable ones is not the availability of the technology — it is the commitment to use it.
Projects built on robust dMRV infrastructure — continuous satellite monitoring, dynamic baselines, transparent evidence trails, near-real-time risk detection — will be better positioned to attract investment, secure verification, manage risk and maintain long-term credibility. As ARR, REDD+, IFM and agroforestry projects continue expanding globally, dMRV is transitioning from a competitive advantage into a market requirement.
Key Takeaways: Digital MRV Across Project Types
Summary of how dMRV applies across the four major nature-based project types.
| Project Type | Primary dMRV Use Case | Key Technology | Primary Benefit |
|---|---|---|---|
| ARR | Biomass growth tracking | NDVI + Canopy Height | Continuous carbon accumulation evidence |
| REDD+ | Deforestation detection | SAR + Change Detection | Real-time forest loss alerts |
| IFM | Forest structure monitoring | LiDAR + Radar | Harvest impact quantification |
| Agroforestry | Tree canopy mapping | High-res optical | Cost-effective smallholder monitoring |
In carbon markets, you cannot manage what you cannot measure. In nature-based projects, you cannot trust what you cannot continuously observe.
Build Your dMRV Infrastructure
Sylithe provides satellite-first digital MRV for ARR, REDD+, IFM and agroforestry carbon projects. Our platform combines multi-satellite monitoring, AI-powered biomass estimation, dynamic baseline management and automated verification workflows into a single integrated system. If you are developing or investing in nature-based carbon projects and need credible, continuous monitoring evidence, we should talk.