 New
New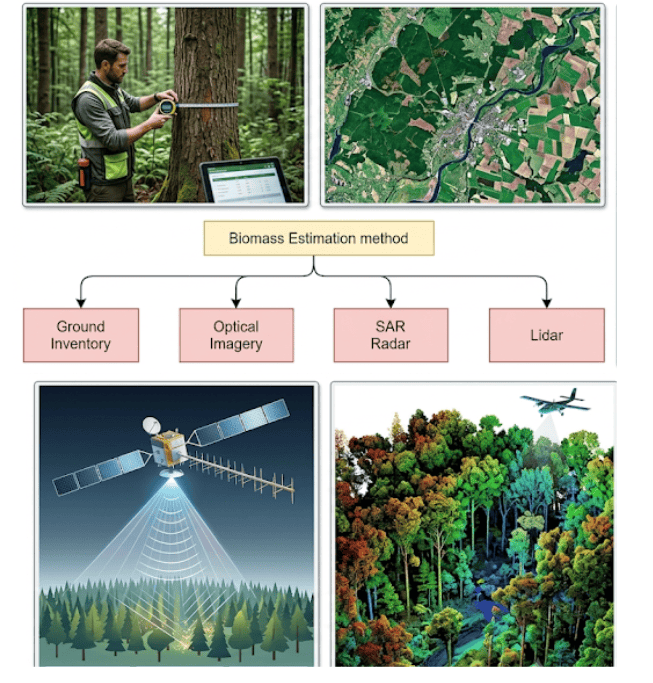
Many nature-based carbon credits ultimately derive their value from changes in biomass and the carbon stored within vegetation. But how we 'measure' that tonne varies wildly. In the carbon market, the error bars are often larger than the sequestration claims.
If you buy a kilo of gold, you weigh it on a scale. If you buy a tonne of carbon, you are buying a statistical estimate. The process of 'Biomass Estimation' is the most technically fraught part of the carbon market. We are attempting to weigh hundreds of millions of living organisms spread across vast, often inaccessible landscapes, with a precision that satisfies institutional investors.
For decades, this was done with tape measures and clipboards. Today, it is done with lasers and machine learning. But as the technology gets more complex, the fundamental question remains the same: 'How much wood is in this forest, and how sure are we?'
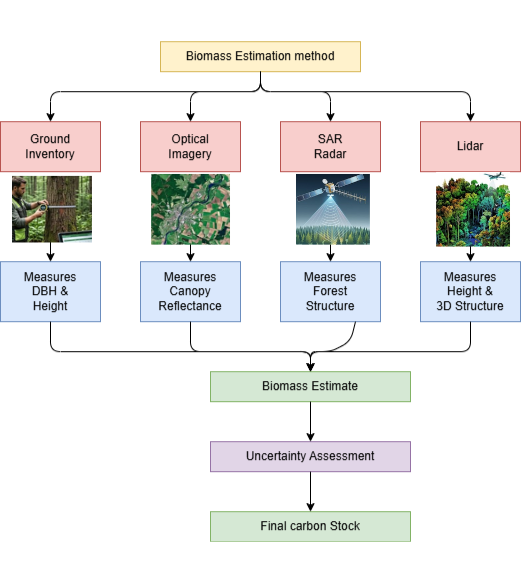
This article is a technical deep dive into the four main methods of biomass estimation. We compare their accuracy, their cost, and their 'Failure Modes', and explain why the highest-integrity projects always use a 'Fusion' approach.
Above-Ground vs Below-Ground Biomass
Key Takeaway
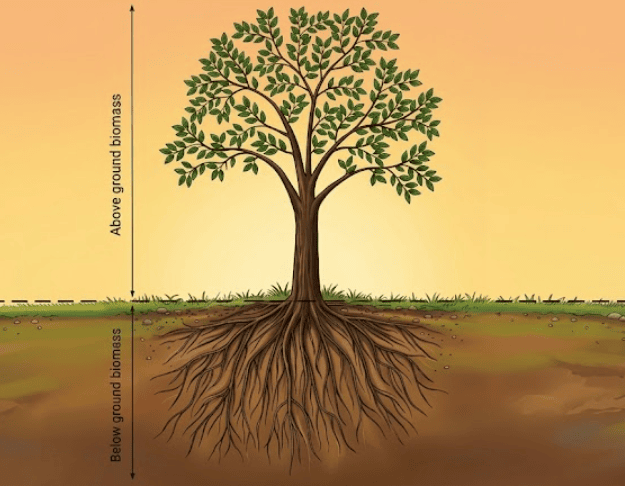
Before we discuss how to measure biomass, we must define what we are measuring. Most readers assume that a forest's carbon is entirely contained in what they can see: the trees. However, forest biomass is divided into two distinct pools: Above-Ground Biomass (AGB) and Below-Ground Biomass (BGB).
Above-Ground Biomass consists of everything visible above the soil: trunks, branches, foliage, and sometimes dead wood and litter, depending on the specific carbon accounting methodology. The vast majority of remote sensing tools—satellites, drones, and LiDAR—are only capable of estimating AGB because they cannot 'see' underground.
Below-Ground Biomass comprises the living root systems of the trees. Depending on the species and the ecosystem, Root biomass commonly ranges from 15% to 40% of above-ground biomass depending on species, climate, and soil conditions. In arid environments like the Deccan Plateau or savannah ecosystems, trees invest heavily in deep root networks, making BGB a massive, often under-credited carbon sink.
Because we cannot easily weigh roots without destroying the tree, BGB is almost always estimated using a standard 'Root-to-Shoot Ratio'. For example, if a methodology assumes a 0.25 ratio, and the AGB is calculated at 100 tonnes, the BGB is automatically estimated at 25 tonnes. This reliance on statistical ratios highlights why precision in AGB measurement is so critical: any error in measuring the canopy is mathematically amplified when estimating the roots.
Why Biomass Estimation Differs Across Ecosystems
Not all forests store carbon in the same way. Biomass estimation methods that perform well in one ecosystem may perform poorly in another.
Why It Matters
- Tropical Rainforests: Extremely high biomass with optical sensor saturation challenges.
- Mangroves: Large below-ground biomass and complex root systems.
- Dry Deciduous Forests: Seasonal canopy changes affect optical measurements.
- Plantations: More uniform structure simplifies biomass modelling.
- Agroforestry Systems: Mixed vegetation creates additional uncertainty.
As a result, high-quality carbon projects often use ecosystem-specific calibration models rather than applying a single biomass estimation approach across all landscapes.
From Biomass to Carbon Credits
Measuring biomass is only the first step in the carbon accounting process. Carbon credit methodologies do not issue credits based on tonnes of wood; they issue credits based on tonnes of carbon dioxide equivalent (CO₂e) stored or removed from the atmosphere.
The conversion follows a standardized workflow. First, scientists estimate the forest biomass. Next, they convert biomass into carbon using a carbon fraction, typically between 45% and 50% of dry biomass. Finally, the carbon stock is converted into CO₂ equivalent using the molecular weight ratio of carbon dioxide to carbon (44/12 = 3.67).
For example, a forest containing 100 tonnes of biomass may contain approximately 47 tonnes of carbon. Multiplying this by 3.67 results in roughly 172 tonnes of CO₂e. This is the quantity ultimately used in carbon credit calculations.
Biomass Conversion Formula
Biomass → Carbon (×0.47) → CO₂e (×3.67) → Carbon Credits
Why Destructive Sampling Is Rare
To truly know how much carbon is in a tree, you have to use 'Destructive Sampling'. This involves cutting the tree down, separating the trunk, branches, and leaves, drying them in a massive kiln until all water is evaporated, and then physically weighing the dry organic matter. This gives you the actual, undeniable biomass.
Obviously, we cannot do this for carbon projects—you cannot protect a forest by cutting it down. Therefore, destructive sampling is extremely rare and is only performed by research institutions to develop 'Allometric Equations'. An allometric equation is a statistical model that predicts the unobservable dry weight of a tree based on non-destructive measurements that are easy to take in the field.
In Non-Destructive Sampling, a forester measures the tree's Diameter at Breast Height (DBH) and its total height. They plug these numbers into the allometric equation created from the destructively sampled trees of the same species. This provides the estimated biomass without harming the forest. The accuracy of all non-destructive carbon MRV relies entirely on the quality of those underlying destructive sampling studies.
Comparing the Four Major Biomass Estimation Methods
| Method | Measures | Key Attribute |
|---|---|---|
| Ground Inventory | DBH | High Accuracy |
| Optical | Greenness | Low Cost |
| SAR | Structure | All-Weather |
| LiDAR | Height | 3D Structure |
Method 1: The Traditional Ground Inventory (The Baseline)
This is the 'Old Way', and it is still the foundation of all legal and scientific standards. Foresters establish small 'Sample Plots' (typically 0.1 hectares) and measure every tree inside. They measure the DBH (Diameter at Breast Height) and often the height using a clinometer.
They then plug these numbers into species-specific allometric equations. If a Teak tree has a DBH of 30cm, the formula tells us it has a biomass of approximately 450kg. The sum of all trees in the plot is then 'Upscaled' to estimate the biomass per hectare.
Why It Matters
- Pros: Extremely high precision at the plot level; indispensable for "Ground-Truthing" AI models.
- Cons: Prohibitively expensive at scale; prone to "Sampling Error" (if your plots aren't perfectly representative, your whole estimate is wrong).
Method 2: Optical Remote Sensing (The Proxy)
This method uses satellites like Sentinel-2 and Landsat to measure the spectral reflectance of the canopy. It uses indices like NDVI (Normalized Difference Vegetation Index) as a proxy for biomass. 'If it looks greener, there must be more carbon'.
While this is the cheapest and most common method used by 'AI Carbon' startups, it has a fatal flaw called 'Saturation'. In dense tropical forests, the canopy looks just as green at 150 tonnes/ha as it does at 400 tonnes/ha. Optical sensors effectively 'stop seeing' carbon once the canopy is closed. This has led to massive biomass underestimation in primary forests and overestimation in young plantations.
Method 3: SAR (Radar) Backscatter (The Structural Probe)
As we explored in our previous deep dive, Synthetic Aperture Radar (SAR) sends microwave pulses that interact with the physical structure of the wood. The amount of energy that 'Backscatters' to the satellite is a direct function of the 'Wood Volume' and 'Surface Roughness'.
Key Takeaway
SAR is superior to optical because it doesn't 'Saturate' as early. L-band radar (wavelength ~24cm) can penetrate deep into the canopy, providing a much better estimate of the carbon stored in the trunks. However, SAR is sensitive to soil moisture and terrain, meaning it requires complex 'Terrain Correction' and 'Speckle Filtering' to be useful for carbon accounting.
Method 4: LiDAR (The 3D Ruler)
LiDAR-derived biomass maps are currently among the most scalable and physically grounded approaches available for large-scale biomass estimation.
| Method | Precision (Hectare level) | Cost (per km²) | Scalability |
|---|---|---|---|
| Ground Inventory | ±5% | $500 - $1,500 | Very Low |
| Optical Proxy | ±25–40% | $1 - $5 | Very High |
| SAR Backscatter | ±15–20% | $5 - $20 | High |
| GEDI LiDAR Fusion | ±8–12% | $20 - $50 | Medium-High |
Actual biomass estimation accuracy varies significantly depending on forest type, sensor quality, plot density, spatial scale, and model design. The ranges shown above are illustrative comparisons rather than universal performance benchmarks.
Machine Learning for Biomass Estimation
Modern biomass estimation increasingly relies on machine learning models that combine satellite observations, climate data, topography, and field measurements. Instead of using a single equation, these models learn relationships from thousands of observations across different forest types.
Algorithms such as Random Forest, Gradient Boosting, XGBoost, and Deep Neural Networks are commonly used to predict biomass at landscape and national scales. These models can identify complex patterns that are difficult to capture using traditional statistical approaches.
Key Takeaway
However, machine learning does not eliminate uncertainty. The quality of the prediction is directly dependent on the quality of the training data. Poor field plots, inaccurate biomass references, or biased datasets can lead to large prediction errors regardless of how sophisticated the algorithm appears.
For this reason, leading carbon MRV platforms use machine learning as a decision-support tool rather than a replacement for field measurements. Ground truth data remains essential for calibration and validation.
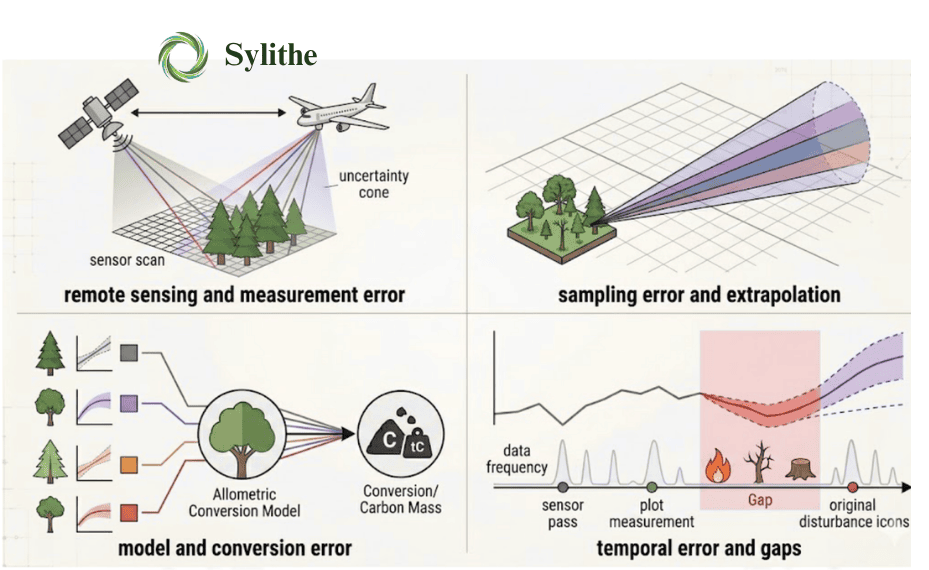
Where Biomass Estimates Go Wrong
Every biomass estimation method contains uncertainty. Understanding where errors originate is often more important than understanding the model itself.
Why It Matters
- Using allometric equations developed for the wrong species.
- Poorly distributed sample plots that fail to represent the landscape.
- GPS and geolocation errors between field plots and satellite imagery.
- Cloud contamination and atmospheric effects in optical imagery.
- Radar signal distortions caused by terrain and soil moisture.
- LiDAR sampling limitations in regions with sparse coverage.
- Machine learning models trained on insufficient ground truth data.
The most robust carbon projects explicitly quantify these uncertainties and incorporate conservative deductions where confidence is lower. Transparency around uncertainty is often a stronger indicator of project quality than the biomass estimate itself.
The Integrity Gap: Why Uncertainty Quantification is the Only Metric that Matters
The carbon market doesn't pay for the biomass we think is there; it pays for the biomass we can prove is there. This is why 'Uncertainty Quantification' (UQ) is the most important concept in biomass estimation. Under Verra's new consolidated methodology, if your biomass estimate has a 20% uncertainty, you must apply a 'Conservative Deduction'. You lose credits because you aren't certain.
High-integrity projects invest in better measurement (like LiDAR-fusion) specifically to 'Lower the Uncertainty'. By moving from a 30% error to a 10% error, the project developer can issue significantly more credits from the same forest. Better measurement isn't just a technical goal; it is a financial optimization.
The Sylithe Hybrid Approach
We don't believe in a 'Single Sensor' solution. Sylithe uses a 'Multi-Model Ensemble'. We combine ground plots (to anchor the data), GEDI LiDAR (to set the height), and Sentinel-1/2 (to fill in the spatial gaps). Our machine learning models are 'Physically Constrained' they aren't allowed to predict biomass levels that are biologically impossible for that specific forest type and climate.
Conclusion: The Future of Weighing Forests
We are moving toward a 'Tier 3' world where biomass is measured hectare-by-hectare with sub-10% uncertainty. This transparency will finally allow forest carbon to be treated as a true financial asset, tradable on institutional exchanges. The journey from the tape measure to the laser is almost complete.
In the carbon market, the quality of your biomass estimate is the quality of your currency.
Audit your biomass inventory
Sylithe provides independent biomass audits for carbon projects using our GEDI-fusion pipeline. We identify hidden biases in your existing allometric equations and provide the uncertainty quantification needed for ICVCM compliance. If you are ready to reach institutional-grade precision, let's talk.