 New
NewREDD+
Forest Protection
The credit lives in the baseline. So does the scrutiny.
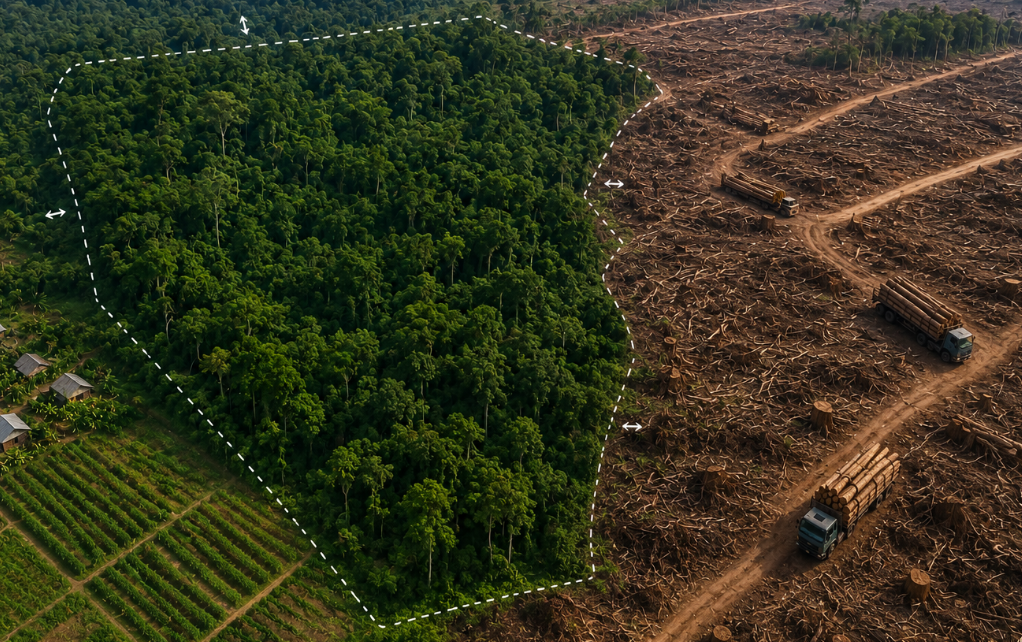
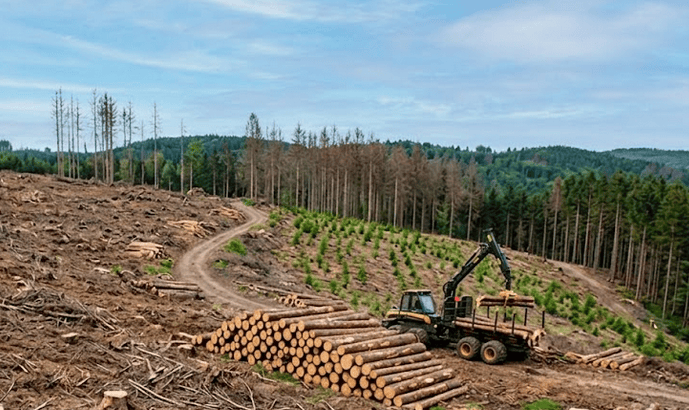
Deforestation accounts for roughly a tenth of global emissions, and REDD+ is the main instrument the world has for paying forests to stay standing. It is also the pathway the market has criticised most, almost entirely over how baselines were built. The forests are real. What had to change is how the counterfactual is evidenced.
5
activities recognised under the UNFCCC framework
2013
Warsaw Framework agreed at COP 19
~11%
of global emissions from deforestation
3
phases: readiness, implementation, results-based finance
What it is
An emission avoided, not a tonne removed
REDD+ credits forest that stays standing when the counterfactual said it would not. That makes it an avoidance instrument, and buyers increasingly account for it on a separate line from removals rather than treating the two as interchangeable.
The hard part
The baseline is the entire argument
Nothing physical marks the difference between a protected forest and a forest that was never threatened. The credit exists only in the gap between observed loss and predicted loss, which is why baseline construction attracts more scrutiny here than anywhere else in the market.
Where it applies
Forests under real, demonstrable pressure
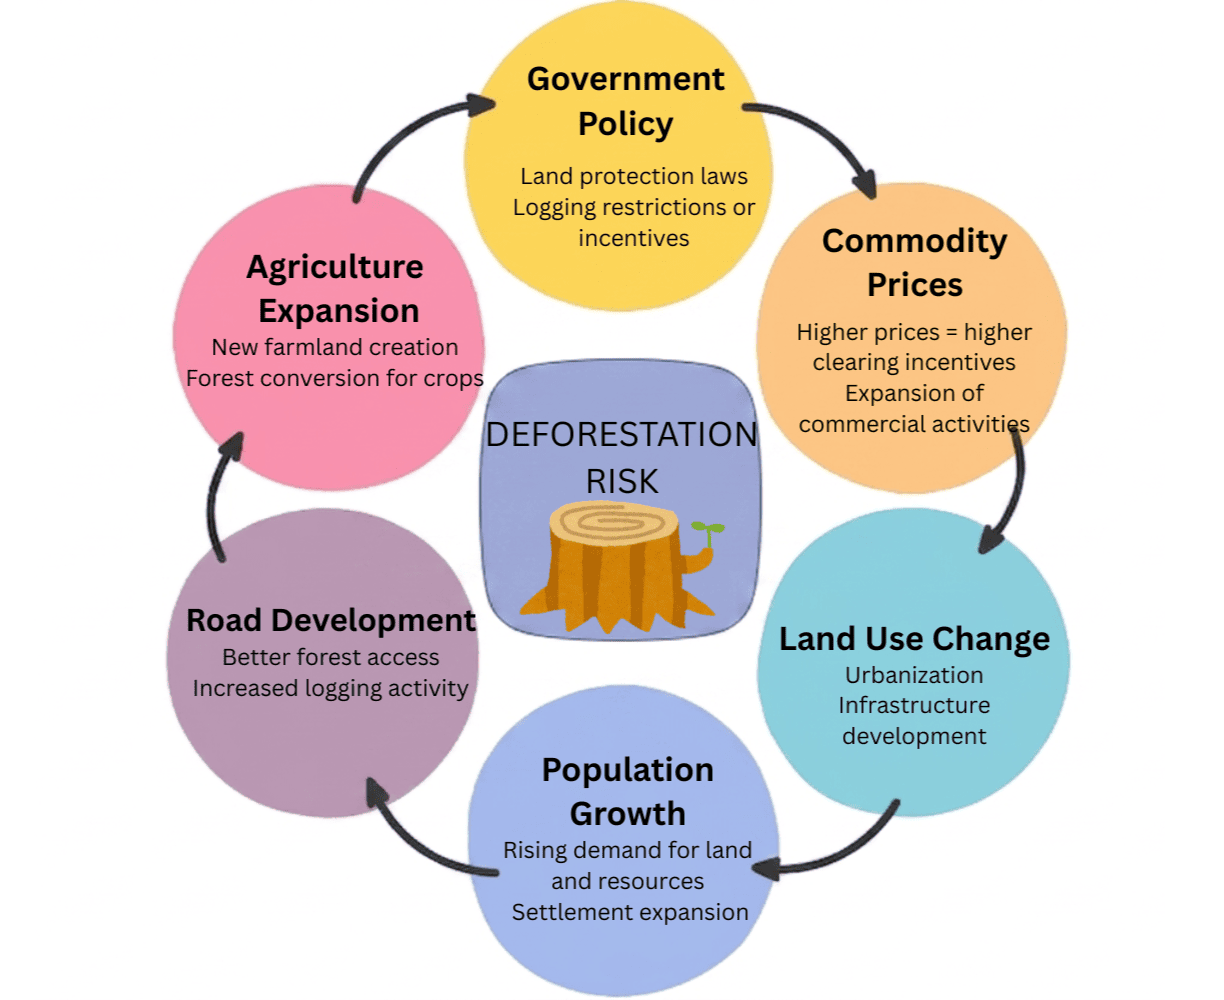
A credible project sits where deforestation drivers are active and documentable: an advancing agricultural frontier, a new road, a commodity price shift. Where the pressure cannot be evidenced from the landscape record, the additionality case does not survive contact with a rater.
What has to be evidenced
Four checkpoints turn avoided loss into a creditable tonne
At the boundary
Establish forest cover and its condition inside the project area from the satellite archive, so the starting stock is an observation rather than an inventory estimate.
At the baseline
Build the counterfactual from comparable land facing the same drivers, and keep testing it against what that land actually does across the crediting period.
At the frontier
Detect loss and degradation as it happens, across the project and the surrounding landscape, so both performance and leakage are caught in the period they occur.
At the ledger
Convert avoided loss into CO₂e through documented carbon densities, then reconcile against safeguards reporting and national accounting to avoid double counting.
Why the counterfactual is everything.
A REDD+ credit is a subtraction between something observed and something that never happened. The observed half is now straightforward. The half that never happened is where every serious criticism of this pathway has landed, and where the methodology reform of the last few years has been aimed.
The framework
What REDD+ covers, and who decided
REDD+ is not a private-market invention. It sits inside the UNFCCC process, and its basic rules were agreed as a package of decisions at COP 19 in Warsaw in 2013, now generally referred to as the Warsaw Framework for REDD+.
That framework recognises five activities: reducing emissions from deforestation, reducing emissions from forest degradation, sustainable management of forests, conservation of forest carbon stocks, and enhancement of forest carbon stocks. It also sets out what a country has to put in place to receive results-based finance, including a national forest monitoring system, a forest reference emission level to measure performance against, measurement and verification arrangements, and reporting on how the agreed social and environmental safeguards are being addressed.
The framework describes three broad phases: readiness, implementation of policies and measures, and results-based payments for verified emission reductions. Most voluntary-market REDD+ projects operate alongside that national architecture rather than inside it, which is exactly where the double-counting and nesting questions come from.
The baseline
Where the criticism actually landed
Under earlier methodologies, a project developer had considerable latitude to choose a reference region and project a future deforestation rate from it. Independent analysis of a large sample of projects found that many had assumed substantially more forest loss than comparable land went on to experience. The consequence was over-crediting rather than invention, but the effect on buyer confidence was the same.
- Reference region selection: choosing which land the project is compared against was, in effect, choosing the answer. Two defensible-looking regions could produce baselines differing by a factor of several.
- Static projections: a rate fixed at project design cannot respond to a commodity price collapse, a change of government or a new road, all of which move real deforestation sharply.
- Self-assessment: when the party that benefits from a high baseline also builds it, the incentive problem is structural rather than a question of individual conduct.
The response has been to take baseline construction out of the developer's hands: jurisdictional allocations, independently produced deforestation risk maps, and periodic reassessment instead of a single projection carried for a decade.

Measurement
What can now be observed directly
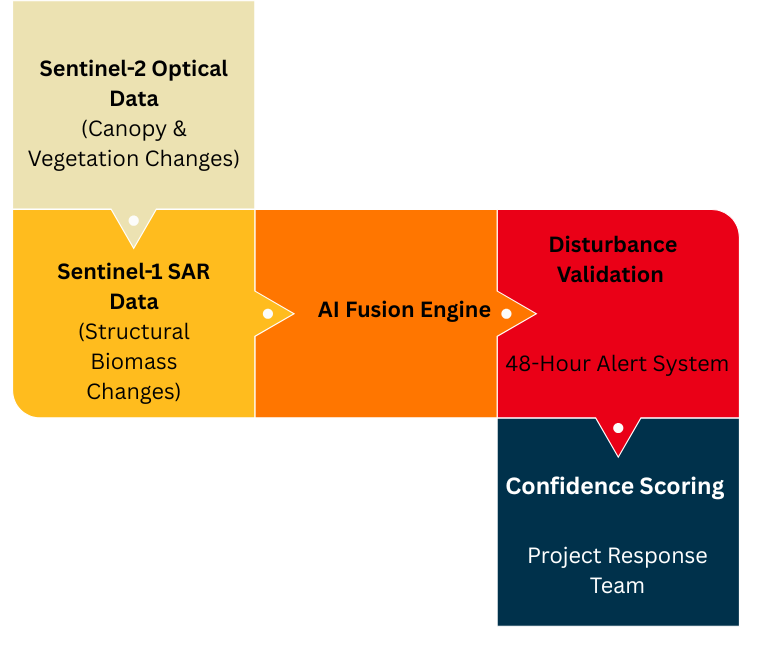
The observed half of the subtraction has become genuinely strong. Where a project once relied on periodic inventories and interpretation, the landscape record is now dense enough to treat forest change as a measurement.
- Optical time series: open Sentinel and Landsat archives give a consistent, independently held record of cover change that predates the project and cannot be reconstructed after the fact.
- Radar for the gaps: SAR sees through cloud and, at the right wavelength, responds to structure rather than reflectance, which is what makes tropical monitoring workable in a wet season and degradation visible under an intact-looking canopy.
- Structure, not just extent: canopy height and biomass modelling distinguish a thinned forest from a cleared one. Degradation is the larger and more often missed share of forest emissions, and extent-only mapping is blind to it.
Scale
Two very different project archetypes
REDD+ projects fall into broadly two shapes, and the evidence a rater interrogates differs sharply between them.
Advancing deforestation frontier
Forest under active, visible pressure from an approaching agricultural or extractive frontier. The additionality case is the strongest available, but leakage risk is correspondingly high because the driver does not disappear when the boundary is drawn.
- Clear, documentable driver
- Strong additionality case
- High leakage exposure
- Needs landscape-wide monitoring
Community-held and tenure-based
Forest managed by the communities living in it, where the project funds enforcement, alternative livelihoods and tenure security. Outcomes are durable when governance is real, and the safeguards reporting carries as much weight with buyers as the tonnage does.
- Tenure and rights evidence
- Benefit-sharing transparency
- Slower, steadier avoided loss
- Safeguards reporting central
A frontier project has the easier additionality argument and the harder leakage problem. A community project inverts both. Neither is a better bet in the abstract; what separates them is whether the specific weakness has been instrumented.
Leakage
Prevented, or simply moved?
If the pressure on a forest is an advancing agricultural frontier, protecting one block does not remove the demand that drove it. Leakage is the share of avoided deforestation that reappears somewhere else, and it is the failure mode most likely to be found by someone other than the project.
Detected: landscape-scale view
Monitoring the full driver catchment, not a belt around the boundary, catches displacement that jumps rather than creeps, and lets the project report it before a rater discovers it independently.
Missed: the narrow leakage belt
A five to ten kilometre monitoring belt is the conventional default. It catches short-distance displacement and is structurally blind to activity that relocates across a district, which is the pattern that actually follows a road.
A project that reports its own leakage with landscape evidence behind it is in a far stronger position than one that reports none and is later shown to have missed it. The credibility difference is a monitoring footprint, not a methodology clause.
REDD+ credibility is a baseline problem.
The forest can be measured. The counterfactual cannot, so it has to be constructed from evidence that is independent of the project and re-tested as conditions change. That is the specific thing Sylithe instruments.
Dynamic control-area baselines
The counterfactual is built from land outside the boundary facing the same drivers, and re-tested every period, so the benchmark moves with the commodity cycle and the drought instead of freezing an assumption from the PDD.
Loss and degradation detection
Optical and radar time series flag clearing and thinning as they appear, including under cloud and canopy, which turns monitoring into an alerting system rather than an annual retrospective.
Landscape-scale leakage view
Monitoring extends well beyond the project boundary, because activity displaced ten kilometres away is invisible to a narrow leakage belt and fatal to the claim when a rater finds it first.
Standards & methodologies
One evidence set, multiple crediting routes
Sylithe structures REDD+ project data so the same underlying records can serve whichever pathway your buyers require.
 VCS
VCSVerra VM0048
The consolidated REDD methodology, which moved baseline setting away from project-developed projections toward jurisdictional allocations and independently produced risk maps.
 IC-VCM
Core Carbon Principles
The integrity bar above the registries. CCP assessment of REDD+ methodologies has become the practical filter most corporate buyers apply before an avoidance credit enters a portfolio.
-nbGJm8Y8.png) BEE
BEEIndian Carbon Market / CCTS
India carries substantial forest under documented pressure alongside strong community tenure law. Sylithe structures evidence so it can travel into the domestic framework as it matures.
Developing a REDD+ project?
The baseline decides whether your tonnes survive a rating. Let's build it from independent landscape evidence, and keep testing it, rather than defending a projection made years ago.
FAQs
Common questions from developers and buyers evaluating REDD+ projects.