 New
New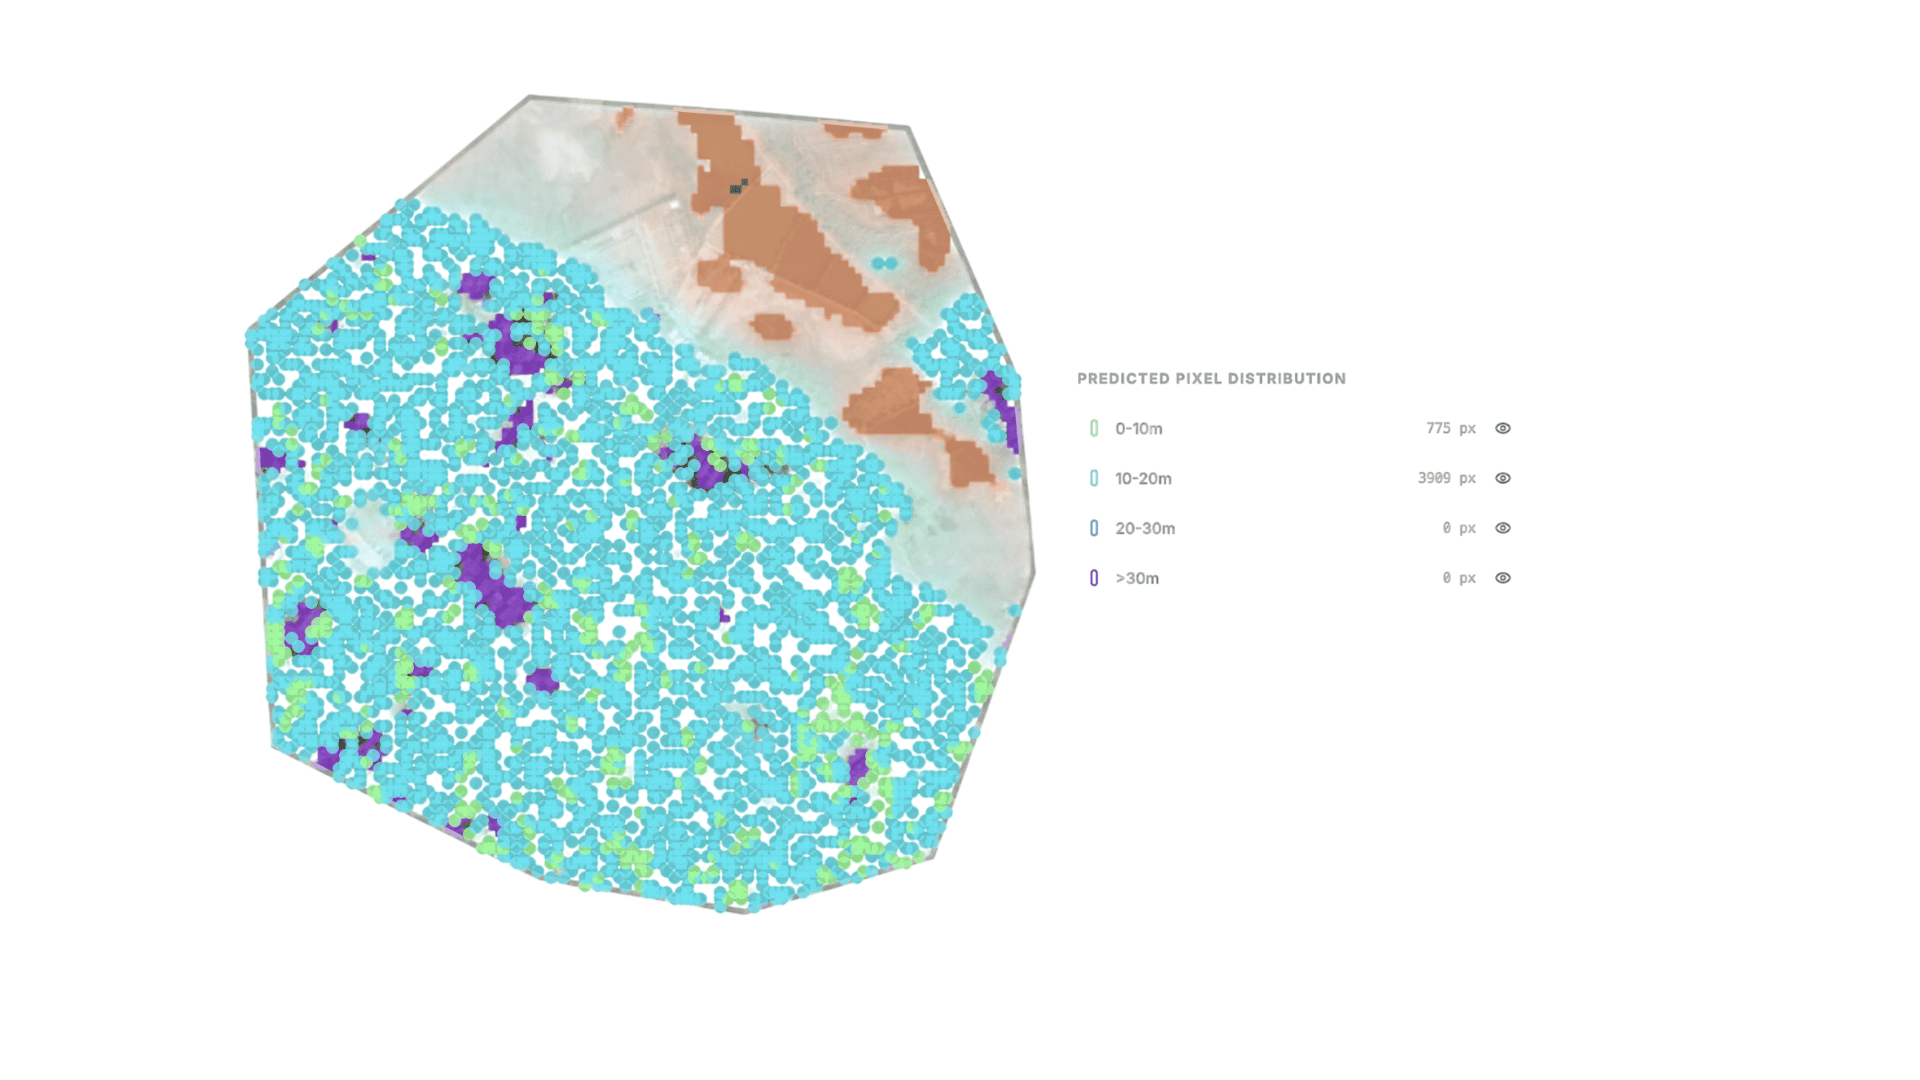
Optical satellites see the 'Skin' of the forest; LiDAR sees the 'Skeleton'. If you aren't measuring height, you aren't measuring carbon you're just guessing.
In the 2010s, carbon monitoring was about 'Area'. We measured how many hectares of forest were lost or gained. In the 2020s, carbon monitoring is about 'Volume'. We have moved from a 2D understanding of the landscape to a 3D inventory of the carbon stored in every cubic meter of vegetation.
The technology driving this shift is canopy height LiDAR for forest carbon (Light Detection and Ranging). By firing laser pulses from the International Space Station and airplanes, we can now map the 'Vertical Profile' of any forest on Earth. For the carbon market, this means moving from 'Global Averages' (which are often wrong by 50% or more) to 'Project-Specific Precision'.
This article explains how spaceborne LiDAR works, how canopy height models (CHM) are built, why canopy height is the 'Master Variable' of biomass estimation, the crucial difference between LiDAR and photogrammetry, how NASA GEDI data India is transforming tropical forest monitoring, and how Sylithe uses 3D structural data to deliver LiDAR-derived carbon credits at Tier 3 accuracy.
The Physics of the Laser: From ISS to Forest Floor
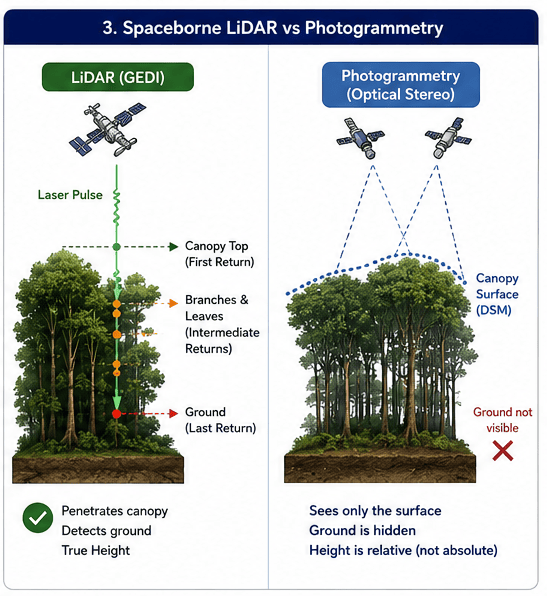
A LiDAR sensor works by emitting a pulse of light and measuring the time it takes to return. Since the speed of light is constant, this time tells us the exact distance. In a forest, a single laser pulse will generate multiple 'Returns'.
Why It Matters
- First Return: The laser hits the top of the canopy (the highest leaves).
- Intermediate Returns: The laser bounces off branches and leaves at different heights within the canopy.
- Last Return: The laser finds a tiny gap in the foliage and hits the actual ground.
By subtracting the 'Last Return' (Ground) from the 'First Return' (Canopy Top), we get the absolute 'Canopy Height'. This is the most accurate measurement of height possible from remote sensing, far superior to the estimates derived from optical imagery.
GEDI: The 3D Census of the Earth’s Forests
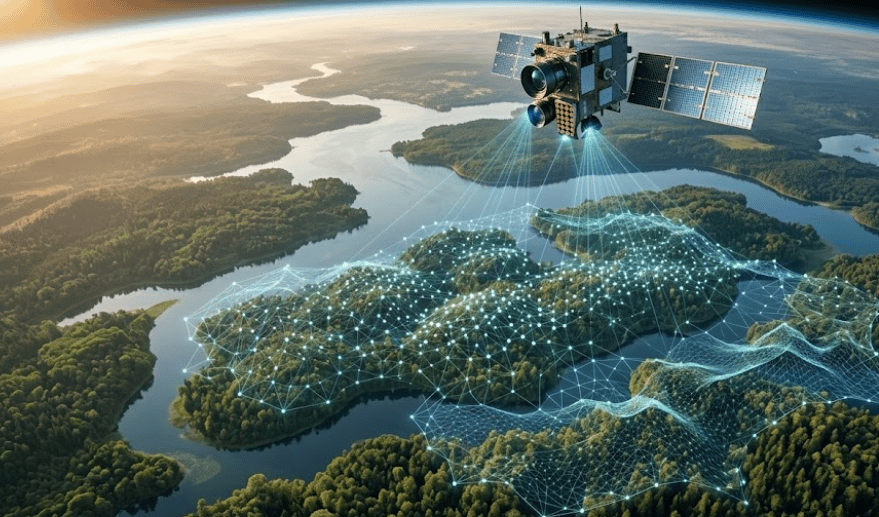
Until recently, LiDAR was limited to expensive airplane surveys. NASA's GEDI (Global Ecosystem Dynamics Investigation) changed everything. GEDI is a 'Waveform LiDAR' instrument on the ISS that has been mapping the world between 51.6° N and S latitudes since 2019.
GEDI doesn't provide a continuous map; it provides 'Footprints' (circles of 25m diameter) every 60 meters along its track. While it looks like a 'Dotted Line' on a map, these billions of high-precision points act as 'Anchor Data'. We use these anchor points to train AI models that can then estimate height for the entire landscape using continuous (but less precise) data from Sentinel-1 and Sentinel-2. This is the 'Fusion' that powers modern biomass mapping.
How GEDI LiDAR Estimates Forest Biomass
GEDI LiDAR forest biomass estimation follows a precise physics-to-carbon pipeline. Unlike simple optical indices (like NDVI) that only infer greenness, GEDI directly measures the three-dimensional architecture of vegetation. Here is how the process works step by step.
- 1.Laser Pulse EmittedGEDI fires a near-infrared laser pulse (1064 nm) from the ISS toward the forest surface. Each pulse illuminates a circular footprint of approximately 25 metres in diameter on the ground.
- 2.Full Waveform RecordedInstead of recording just a single return, GEDI captures the full waveform a continuous record of how laser energy returns over time. This encodes the distribution of vegetation and ground across every vertical layer of the forest.
- 3.Relative Height Metrics ExtractedFrom each waveform, scientists extract Relative Height (RH) metrics: RH25, RH50, RH75, and RH98. RH98 is equivalent to the 98th percentile canopy height. Together, these metrics describe both the maximum height and the vertical density profile of the forest.
- 4.Allometric Biomass Model AppliedThe RH metrics are fed into species- and region-specific allometric equations that relate structural measurements to Above-Ground Biomass (AGB). These equations are calibrated using field plots where researchers have directly measured tree diameter, height, and weight.
- 5.Carbon EstimationAGB is converted to carbon stock using a standard carbon fraction (typically 0.47 meaning approximately 47% of dry biomass is carbon). This gives a carbon density value in tonnes of CO₂-equivalent per hectare, which is the foundation of any carbon credit calculation.
The power of GEDI LiDAR forest biomass estimation is that it captures what optical satellites fundamentally cannot: the vertical distribution of wood volume. A plantation and a primary forest can look identical from above in an optical image, but GEDI's waveform will show the stark difference in their internal architecture and therefore their true carbon storage.
From LiDAR Returns to a Canopy Height Model (CHM)
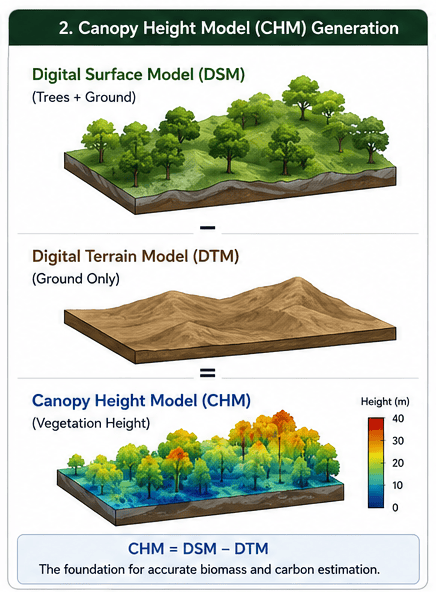
The canopy height model CHM satellite is one of the most important derived products in forest remote sensing. A CHM is a raster map where each pixel represents the height of the vegetation above the ground at that specific location. It is the foundation for nearly every downstream analysis biomass estimation, forest degradation detection, species composition inference, and carbon credit quantification.
A CHM is generated using a simple but powerful formula: Canopy Height = DSM − DTM. The Digital Surface Model (DSM) captures the elevation of the highest surface at each point which in a forest is the top of the canopy. The Digital Terrain Model (DTM) captures the bare-earth elevation the actual ground level beneath the vegetation. Subtracting the DTM from the DSM removes topographic variation and gives you the true vegetation height.
This is where canopy height LiDAR for forest carbon has an enormous advantage over optical methods. Creating a reliable DTM requires knowing where the ground actually is and in dense tropical forests, the ground is completely hidden beneath the canopy. LiDAR pulses, by penetrating gaps in the foliage and reaching the ground, can construct an accurate DTM even under closed-canopy conditions. The resulting canopy height model CHM satellite product, when derived from GEDI or airborne LiDAR, achieves accuracy of ±1–3 metres for canopy height, compared to ±10–20 metre errors typical of photogrammetry in similar conditions.
LiDAR vs. Photogrammetry: The "Digital Surface" Illusion
Many low-cost MRV providers use 'Photogrammetry' (also called Structure from Motion or Stereo Mapping) to estimate height. They take two satellite images from different angles and create a 3D model. While this looks impressive, it has a fatal flaw: it can only see the 'Top Surface'.
In a dense tropical forest, photogrammetry cannot see the ground. If you don't know where the ground is, you don't know how tall the trees are you only know how high the canopy surface is relative to the perceived ground. This often leads to 'Height Underestimation' in hilly areas and 'Height Overestimation' in dense secondary forests. LiDAR is the only technology that penetrates the canopy to find the true zero-point (the ground).
Spaceborne LiDAR vs Photogrammetry: Direct Comparison
Spaceborne LiDAR vs Photogrammetry for Forest Carbon MRV
| Parameter | LiDAR (GEDI / Airborne) | Photogrammetry (Stereo) |
|---|---|---|
| Ground Detection | Yes pulses penetrate canopy gaps | Limited only in open areas |
| Canopy Penetration | Yes full vertical profile captured | No surface model only |
| Biomass Accuracy | High (Tier 3 achievable) | Medium (Tier 2 at best) |
| Carbon MRV Quality | Excellent IPCC Tier 3 | Moderate IPCC Tier 2 |
| Performance in Dense Forests | Excellent | Weak high error rates |
| DTM Accuracy Under Forest | High (±0.5–1.5m) | Poor (±5–20m) |
| CHM Accuracy | ±1–3m | ±10–20m in dense cover |
| Suitability for Carbon Credits | High accepted by Verra, Gold Standard | Limited conservative deductions apply |
Comparison based on published peer-reviewed benchmarks for tropical forest conditions.
Why Vertical Structure Matters for Carbon Density
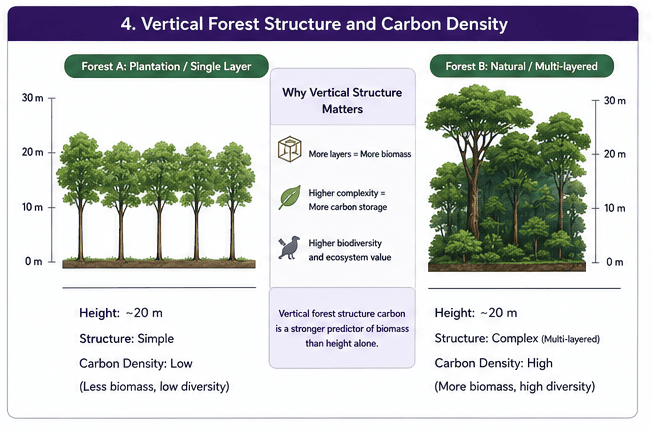
Carbon density isn't just about the tallest tree. It's about how much wood is packed into the 'Understory' and 'Mid-canopy'. Two forests can both be 20m tall, but if one is a 'Primary Forest' with multiple layers of vegetation and the other is a 'Plantation' with nothing but trunks and air under the top leaves, the primary forest will have 2x the carbon.
Two forests can both be 20m tall, but if one is a Primary Forest with multiple layers of vegetation and the other is a Plantation with nothing but trunks and air under the top canopy, the primary forest stores dramatically more carbon. Vertical forest structure carbon is quantified through allometric equations that relate measurable structural properties height, diameter, wood density to biomass. Canopy height LiDAR for forest carbon provides the height input to these equations at landscape scale.
How Canopy Height Drives Carbon Density
| Forest Type | Canopy Height | Carbon Density (tCO₂e/ha) | Vertical Layers |
|---|---|---|---|
| Young Plantation | 3–8 m | Low (10–40) | 1 layer |
| Mature Plantation | 12–18 m | Medium (60–120) | 1–2 layers |
| Secondary Forest | 15–22 m | Medium–High (100–200) | 2–3 layers |
| Mature Primary Forest | 28–45 m | High (250–500+) | 4–5 layers |
Carbon density estimates based on IPCC Tier 1 defaults and published tropical forest studies.
LiDAR provides the 'Plant Area Index' (PAI) at every vertical level. It tells us the 'Complexity' of the forest. High complexity correlates with high biomass and high biodiversity. By using canopy height LiDAR for forest carbon, Sylithe can differentiate between high-integrity native forests and low-integrity monocultures that might look similar on a 2D map.
NASA GEDI Data in India: Mapping Tropical Forests
NASA GEDI data India provides one of the most valuable datasets for biomass estimation in tropical forests where field measurements remain limited. India's forest carbon landscape is enormously diverse from the dense evergreen forests of the Western Ghats to the dry deciduous forests of Central India, the alpine forests of the Himalayas, and the rich tropical biodiversity of Northeast India.
Why It Matters
- Western Ghats: One of the world's 36 biodiversity hotspots. NASA GEDI data India has been used to map biomass across Kerala, Karnataka, and Tamil Nadu, revealing that protected forest patches store up to 400 tCO₂e/ha nearly double previous optical estimates.
- Himalayan Forests: High-altitude conifer and broadleaf forests across Uttarakhand, Himachal Pradesh, and the northeast states. GEDI's ability to measure height in complex terrain makes it particularly valuable here, where topographic variation makes photogrammetry unreliable.
- Central Indian Forests: The dry deciduous forests of Madhya Pradesh and Chhattisgarh critical for REDD+ and avoided deforestation projects. NASA GEDI data India allows baseline biomass establishment across millions of hectares at low cost.
- Northeast India: The tropical forests of Assam, Meghalaya, Nagaland, and Mizoram contain some of India's highest biomass density. These forests are increasingly being integrated into voluntary carbon markets, and GEDI provides the verification backbone.
NASA GEDI data India provides one of the most valuable datasets for biomass estimation in tropical forests where field measurements remain limited. The open availability through NASA's Earthdata platform means any carbon project developer, forest department, or MRV provider can access this data at no cost. The challenge lies in processing the raw waveforms extracting RH metrics, applying regional allometric models, fusing with SAR and optical data, and validating against field plots.
LiDAR-Derived Carbon Credits: From Measurement to Market
LiDAR-derived carbon credits represent the next generation of forest carbon finance credits backed by precise, three-dimensional measurement rather than statistical inference from two-dimensional satellite imagery. The use of LiDAR-derived carbon credits follows a rigorous MRV framework with five key phases.
LiDAR-derived carbon credits begin with an accurate baseline. GEDI waveforms and/or airborne LiDAR map the existing Above-Ground Biomass (AGB) at project start. This 3D baseline is far more accurate than default IPCC values, reducing conservative deductions and increasing credit value.
Historical GEDI time-series (available since 2019) can demonstrate pre-project deforestation or degradation trends, providing a data-rich evidence base for additionality claims that strengthens LiDAR-derived carbon credits under any methodology.
Annual or biennial GEDI acquisitions track biomass change within the project boundary. Fused with continuous SAR and optical data, this produces monthly-to-annual biomass change maps capturing any losses from fire, degradation, or illegal logging.
Third-party auditors verify LiDAR-derived carbon credits by cross-checking LiDAR-based biomass estimates against a reserved 20% validation dataset of field plots. Because LiDAR uncertainty is quantifiable, verification is faster with smaller conservative deductions.
After verification, LiDAR-derived carbon credits are issued under Verra VCS, Gold Standard, or India's CCTS. Each credit represents one tonne of CO₂-equivalent. Projects using LiDAR typically issue 15–30% more credits per hectare than equivalent projects using older precision methods.
The growing adoption of LiDAR-derived carbon credits reflects a broader shift toward measurement-based carbon accounting. Registries like Verra are increasingly mandating higher-precision monitoring for large projects. IPCC Tier 3 accuracy which delivers the highest credit values and lowest discount rates is essentially only achievable with LiDAR as the primary height measurement tool.
Sylithe's 3D Biomass Pipeline
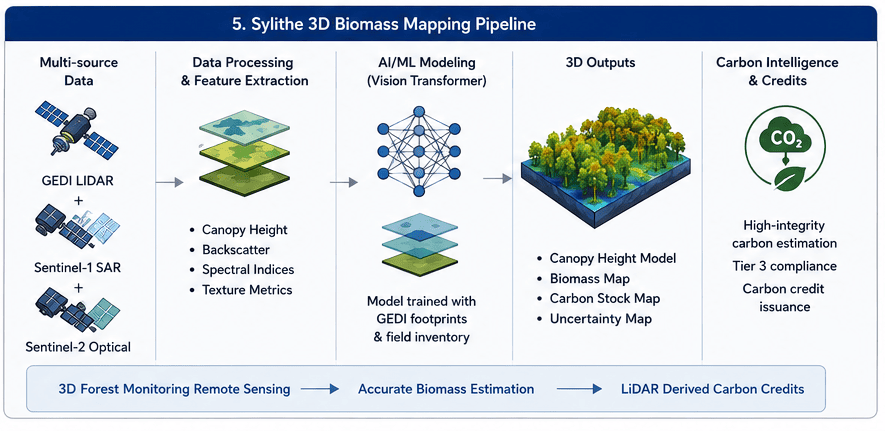
We have built a proprietary pipeline that integrates GEDI LiDAR waveforms with Sentinel-1 SAR and Sentinel-2 Optical data. Our process follows three steps:
Why It Matters
- Calibration: We match local GEDI footprints to ground-truth inventory plots to build species-specific height-to-biomass models.
- Extrapolation: We use a Vision Transformer (ViT) to "Spread" the GEDI height information across the entire project area using the spectral and textural signatures from continuous satellites.
- Validation: We set aside 20% of the GEDI data to independently verify the accuracy of the final 3D map, ensuring the uncertainty is within the limits required by Tier 3 standards.
The Future: Drone-LiDAR and Beyond
While spaceborne LiDAR is great for landscapes, we use 'Drone-LiDAR' for high-value project validation. A drone flying at 50m with a LiDAR sensor can map every single tree in a forest with 2cm precision. This is the 'Digital Inventory' of the future, where every individual tree becomes a tagged, monitored carbon asset.
In the carbon market of 2026, the vertical dimension is the only dimension that matters for integrity.
Audit your forest structure
Sylithe is the leader in 3D forest monitoring in India. We help project developers use GEDI and airborne LiDAR to reach Tier 3 biomass accuracy, reducing 'Conservative Deductions' and increasing credit value. If you are ready to see your forest in 3D, let's talk.