 New
New
You can see a tree disappear from space. You cannot see 10 tonnes of carbon leaving the soil. That is the hardest measurement problem in climate finance.
Soil is the largest terrestrial carbon pool on Earth, containing more carbon than the atmosphere and all vegetation combined. Yet, in the multibillion-dollar carbon market, soil carbon credits represent a tiny fraction of the total volume. The reason isn't a lack of potential it is a lack of provability. We are currently in the midst of a technical arms race to solve the 'Soil MRV' problem: how to verify that a farmer in Punjab or a rancher in the Deccan has actually sequestered carbon in their dirt, and doing so at a cost that doesn't bankrupt the project.
The financial stakes are massive. Estimates suggest that regenerative agriculture and soil restoration could sequester between 1 and 5 gigatonnes of CO2 per year globally. At a price of $20/tonne, that is a $100 billion annual market. At $100/tonne, it is a $1 trillion climate asset class. But until we can measure it with the same rigor we apply to a financial audit, that value remains 'stranded'.
Why Soil Carbon Is Becoming the Next Major Carbon Asset Class
For years, the voluntary carbon market was dominated by forestry (REDD+) and renewable energy. But a structural shift is underway. Food and beverage giants with massive agricultural footprints are realizing they cannot hit their Net-Zero targets without addressing their agricultural supply chains. This has pushed regenerative agriculture into the spotlight as the primary mechanism for Scope 3 removals.
Simultaneously, under Article 6 of the Paris Agreement, sovereign nations are seeking new avenues for high-integrity carbon trading. Sustainable supply chains are being transformed from a compliance headache into a potential revenue stream through soil carbon finance. The demand is there, the prices for high-quality removal credits are rising, and the agricultural carbon market is poised for explosive growth—provided the MRV bottleneck can be solved.
The Complexity of the Soil Column: Why SOC Is So Hard to Measure
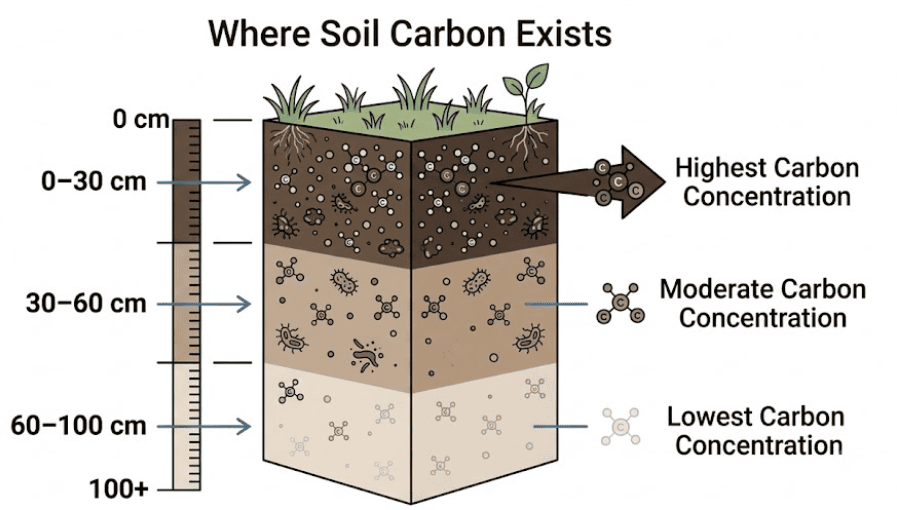
To understand the MRV challenge, you have to understand the spatial and temporal variability of Soil Organic Carbon (SOC). Unlike a forest, where biomass is concentrated in visible trunks, SOC is a mix of decaying plant matter, microbial biomass, and stable humus distributed throughout the top 30-100cm of the soil.
Why It Matters
- Extreme Spatial Variability: Carbon levels can vary by 50% across a single 1-acre field. A sample taken next to a tree root will look vastly different from one taken in a tractor path.
- Temporal Lag: While trees grow visibly every season, SOC takes years to build. A 0.1% increase in SOC is a massive climate win, but it is often smaller than the margin of error in lab equipment.
- Bulk Density Challenges: You cannot measure carbon as a percentage alone. You must know the soil's "Bulk Density" (weight per volume) to calculate the actual mass of carbon. Measuring bulk density is hard, labor-intensive, and prone to significant error.
In the Indian context, these challenges are amplified by small landholdings. Verifying a 10,000-hectare project in the US might involve 10 large owners. Verifying the same area in India might involve 5,000 smallholder farmers. The cost of traditional sampling per farmer makes most projects economically unviable before they even begin.
The Hierarchy of Measurement: Finding What Works at Scale
Comparison of Soil Carbon Measurement Methods
Evaluating the trade-offs between traditional sampling, sensors, and remote sensing.
| Method | Accuracy | Cost | Scalability | Use Case |
|---|---|---|---|---|
| Wet Chemistry | Very High | Very High | Low | Baseline |
| NIRS (Proximal Sensing) | Medium-High | Low | High | Field Sampling |
| Satellite Proxies | Medium | Very Low | Very High | Monitoring |
| Hybrid Tier 3 | High | Medium | High | Carbon Projects |
The Economics of Soil Carbon MRV
The financial viability of a soil carbon project hinges entirely on the MRV approach. Traditional manual measurement is simply too expensive for the developing world, acting as a 'measurement tax' that prevents smallholder farmers from participating.
Traditional vs Digital MRV Cost Comparison
How technology shifts the economic feasibility of soil carbon projects.
| Item | Traditional MRV | Digital MRV |
|---|---|---|
| Sampling Cost | ₹2,000 - ₹5,000 per sample | Reduced by 60-80% via targeted sampling |
| Monitoring Cost | High (annual physical visits) | Low (continuous satellite tracking) |
| Verification Cost | High (manual document review) | Low (automated data pipelines) |
| Credit Issuance Time | 18 - 24 months | 6 - 12 months |
| Farmer Participation | Restricted to large landowners | Accessible to smallholders via aggregation |
Major Soil Carbon Methodologies Used Globally
The carbon markets have evolved stringent methodologies to govern how soil carbon is measured and credited. The most prominent include Verra's VM0042 (Methodology for Improved Agricultural Land Management) which has become a standard for regenerative agriculture projects globally. The Gold Standard SOC Framework also provides robust guidelines, particularly focused on smallholder inclusion and sustainable development goals. Additionally, the Climate Action Reserve (CAR) offers the Soil Enrichment Protocol, widely used in North America.
How AI Is Changing Soil Carbon Measurement
The integration of Artificial Intelligence is the bridge between sparse physical samples and landscape-scale verification. Algorithms like Random Forest and XGBoost are particularly adept at processing complex, non-linear environmental datasets. By ingesting thousands of data points—from global Soil Grids to local field measurements—these models perform Digital Soil Mapping with unprecedented accuracy.
Key Takeaway
Crucially, AI doesn't just predict the carbon value via spatial interpolation; it calculates Uncertainty Quantification. Knowing exactly how confident the model is at any given pixel allows project developers to strategically deploy physical sampling only where the model needs more data, drastically optimizing field operations.
The Satellite Revolution: Measuring Soil from Orbit
Can a satellite 800km away tell you what's happening under the dirt? Not directly, but it can provide the 'Contextual Layer' that makes models work. Sylithe's soil carbon pipeline uses three primary satellite data streams to estimate SOC.
Why It Matters
- Bare Soil Reflectance: During the short window between harvest and planting, satellites like Sentinel-2 can see the soil. Darker soil often correlates with higher organic matter. We use multi-temporal composites to find these "clear soil" windows.
- Net Primary Productivity (NPP): We measure how much biomass the field produces over a year. Since approximately 30-40% of plant carbon is pumped into the soil through roots (the "liquid carbon pathway"), NPP is a highly reliable proxy for carbon input.
- Thermal and SAR Signatures: Soil moisture is a primary driver of SOC decomposition. Sentinel-1 (Radar) and thermal bands allow us to model soil moisture regimes at 10m resolution, providing the "decay rate" variable for our models.

India's Regulatory Future: IPCC Tier 3 and the Green Taxonomy
India is currently developing its own Green Taxonomy and domestic carbon market (CCTS). A critical question for Indian policy-makers is whether to allow Tier 2 (regional averages) or mandate Tier 3 (project-specific verification).
If India mandates Tier 3, it will ensure high-integrity credits that can be exported (Article 6), but it risks excluding small farmers who can't afford the MRV. If it allows Tier 2, it will scale fast but might face the same 'Integrity Crash' that hit the voluntary REDD+ market in 2023. At Sylithe, we argue for a 'Hybrid Tier 3' using high-resolution satellite proxies to provide the spatial detail, validated by a small, strategically placed network of 'Reference Soil Sites' across India's agro-climatic zones.
Technical Insight
The 'Minimum Detectable Change' (MDC) is the most important number in soil carbon finance. If your MRV system has an MDC of 2 tonnes and your project only sequesters 1 tonne per year, you cannot issue credits annually. You must wait 3 years for the 'signal' to rise above the 'noise'.
The Path Forward
Soil carbon is not just an environmental asset; it is a food security asset. Soil with higher organic carbon holds more water, requires less synthetic fertilizer, and is more resilient to the heatwaves that are now a permanent feature of the Indian climate. By solving the MRV problem, we are not just unlocking carbon finance; we are financing the climate-proofing of Indian agriculture.

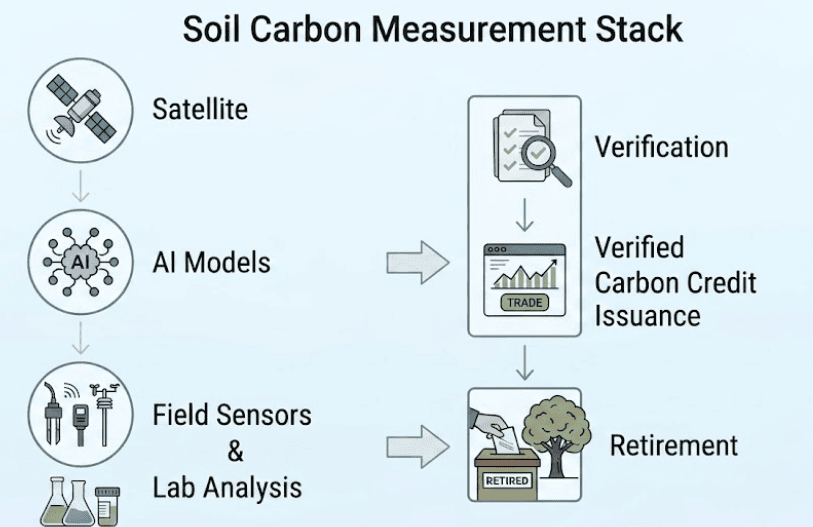
The future of soil carbon measurement is not a single tool, but a 'Stack': satellite context + proximal sensing in the field + machine learning models + a few high-precision lab samples. This stack reduces the 'Verification Tax' from 40% of revenue to under 10%, finally making soil carbon viable at the smallholder scale.
In the soil carbon market, the product is the carbon, but the currency is the data.
Measure your soil impact
Sylithe is building India's most advanced soil carbon modeling pipeline for regenerative agriculture projects. We combine sub-metre satellite proxies with automated sampling design to provide Tier 3-grade verification for Indian agribusiness. If you are ready to turn your supply chain's soil into a verified carbon sink, we should talk.
Key Takeaways & Metrics
A summary of the core concepts discussed in this article.
| Concept | Relevance | Impact Level | Status |
|---|---|---|---|
| Methodology | Core to accurate MRV | High | Active |
| Integrity | Essential for credit value | Critical | Mandatory |
| Technology | Enables scale | High | Growing |
Data synthesized from Sylithe Research.